Ch.15 - Chemical Equilibrium
Brown - Chemistry: The Central Science 14th Edition
Brown14th EditionChemistry: The Central ScienceISBN: 9780134414232Non è quello che usi tu?Cambia libro di testo
Capitolo 15, Problema 98e

The phase diagram for SO2 is shown here. (e) At which of the three red points does SO2(g) behave least ideally?
Phase diagram for SO2 showing solid, liquid, gas, and critical points with marked points A, B, C, D.

Guida verificata passo dopo passo
1
Identify the three red points on the phase diagram: A, B, and C.
Recall that gases behave least ideally at high pressures and low temperatures.
Examine the phase diagram to determine the pressure and temperature at each of the three points.
Compare the pressures and temperatures at points A, B, and C to determine which point has the highest pressure and/or lowest temperature.
Conclude that the point with the highest pressure and/or lowest temperature is where SO2(g) behaves least ideally.

Risposta video verificata per un problema simile:

Questa soluzione video è stata consigliata dai nostri tutor come utile per risolvere questo problema.
Durata del video:
1m

Concetti chiave

Ecco i concetti essenziali che devi comprendere per rispondere correttamente alla domanda.

Ideal Gas Behavior

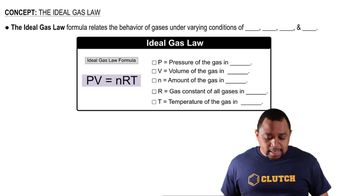
Ideal gas behavior refers to the theoretical behavior of gases that follow the ideal gas law (PV=nRT) perfectly, where pressure (P), volume (V), temperature (T), and the number of moles (n) are related. Real gases deviate from this behavior under high pressure and low temperature, where intermolecular forces and molecular volume become significant. Understanding these deviations is crucial for determining conditions under which a gas behaves least ideally.
Video consigliato:
Percorso guidato
01:15
Ideal Gas Law Formula

Phase Diagrams

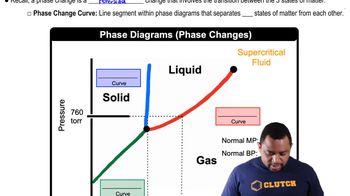
A phase diagram is a graphical representation that shows the phases of a substance (solid, liquid, gas) as a function of temperature and pressure. It includes critical points, triple points, and phase boundaries, which indicate the conditions under which different phases coexist. Analyzing phase diagrams helps predict the state of a substance under varying conditions and is essential for understanding the behavior of SO2 in the given question.
Video consigliato:
Percorso guidato
03:22
Phase Changes in Diagrams

Critical Point

The critical point on a phase diagram marks the end of the liquid-gas phase boundary, beyond which the distinction between liquid and gas phases disappears, resulting in a supercritical fluid. At this point, properties of the substance change dramatically, and it can exhibit behaviors of both phases. Understanding the critical point is vital for identifying conditions where SO2 behaves least ideally, as gases near this point often show significant deviations from ideal behavior.
Video consigliato:
Percorso guidato
03:05
Boiling Point Elevation