Ch.14 - Chemical Kinetics
Brown - Chemistry: The Central Science 15th Edition
Brown15th EditionChemistry: The Central ScienceISBN: 9780137542970Non è quello che usi tu?Cambia libro di testo
Capitolo 14, Problema 4b

Suppose that for the reaction K+L⟶M, you monitor the production of M over time, and then plot the following graph from your data: b. Is the reaction completed at 𝑡=15 min?

Guida verificata passo dopo passo
1
insert step 1> Identify the type of graph provided (e.g., concentration vs. time, rate vs. time) and understand what it represents in terms of the reaction K + L ⟶ M.
insert step 2> Analyze the graph to determine the trend of the concentration of M over time. Look for any plateaus or leveling off in the graph, which might indicate the completion of the reaction.
insert step 3> Check if the concentration of M remains constant after a certain time point, particularly at t = 15 min. If the concentration of M does not change after this time, it suggests that the reaction is complete.
insert step 4> Consider any additional information that might be provided, such as the initial concentrations of K and L, to further support your analysis of whether the reaction is complete.
insert step 5> Conclude based on the graph analysis whether the reaction is complete at t = 15 min, ensuring to explain your reasoning based on the observed data trends.

Risposta video verificata per un problema simile:

Questa soluzione video è stata consigliata dai nostri tutor come utile per risolvere questo problema.
Durata del video:
55s

Concetti chiave

Ecco i concetti essenziali che devi comprendere per rispondere correttamente alla domanda.

Reaction Completion

Reaction completion refers to the point at which the reactants have been fully converted into products, and no further change in concentration occurs. In the context of a chemical reaction, this is often indicated by a plateau in the concentration of products over time, suggesting that the forward reaction has reached equilibrium or that the reactants have been entirely consumed.
Video consigliato:
Percorso guidato
00:47
Complete Ionic Equations

Rate of Reaction

The rate of reaction describes how quickly reactants are converted into products over time. It can be influenced by various factors such as concentration, temperature, and the presence of catalysts. Monitoring the production of a product like M over time allows for the determination of the reaction rate and can help identify when the reaction has completed.
Video consigliato:
Percorso guidato
02:03
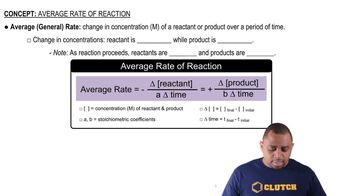
Average Rate of Reaction

Graph Interpretation

Graph interpretation involves analyzing plotted data to extract meaningful information about a chemical reaction. In this case, the graph showing the production of M over time can reveal trends such as increases in concentration, stabilization, or declines, which are crucial for determining whether the reaction has reached completion at a specific time, such as t=15 min.
Video consigliato:
Percorso guidato
03:13
Intepreting the Band of Stability