
Ch.11 - Liquids & Phase Changes
McMurry - Chemistry 8th Edition
McMurry8th EditionChemistryISBN: 9781292336145Non è quello che usi tu?Cambia libro di testo
Capitolo 11, Problema 32

The following phase diagram shows part of the liquid–vapor phase-transition boundaries for two solutions of equal con- centration, one containing a nonvolatile solute and the other containing a volatile solute whose vapor pressure at a given temperature is approximately half that of the pure solvent. Phase diagram showing liquid-vapor boundaries for solutions with volatile and nonvolatile solutes.
(d) Based on your drawing, what is the approximate normal boiling point of the pure solvent?

Guida verificata passo dopo passo
1
Identify the curve that represents the pure solvent. This is typically the curve that is not affected by the presence of solutes.
Locate the point on the pure solvent curve where the pressure is equal to 1 atm (normal atmospheric pressure).
Determine the temperature at this point, as this temperature represents the normal boiling point of the pure solvent.
Compare this temperature with the temperatures of the solutions containing nonvolatile and volatile solutes to understand the effect of solutes on boiling points.
Note that the normal boiling point is the temperature at which the vapor pressure of the liquid equals the external pressure (1 atm).

Risposta video verificata per un problema simile:

Questa soluzione video è stata consigliata dai nostri tutor come utile per risolvere questo problema.
Durata del video:
5m

Concetti chiave

Ecco i concetti essenziali che devi comprendere per rispondere correttamente alla domanda.

Phase Diagram

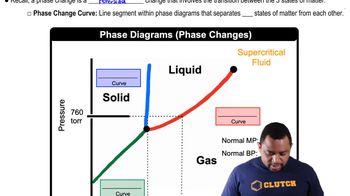
A phase diagram is a graphical representation that shows the phases of a substance as a function of temperature and pressure. It illustrates the boundaries between different phases, such as solid, liquid, and gas, and indicates the conditions under which these phases coexist. In the context of solutions, phase diagrams can also depict the effects of solutes on the boiling and freezing points of solvents.
Video consigliato:
Percorso guidato
03:22
Phase Changes in Diagrams

Boiling Point and Vapor Pressure

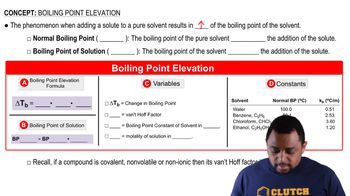
The boiling point of a liquid is the temperature at which its vapor pressure equals the external pressure surrounding the liquid. When a solute is added to a solvent, it typically lowers the vapor pressure of the solution compared to the pure solvent, which in turn raises the boiling point. This phenomenon is known as boiling point elevation and is crucial for understanding how solutes affect the boiling point of a solvent.
Video consigliato:
Percorso guidato
03:05
Boiling Point Elevation

Volatile vs. Nonvolatile Solutes

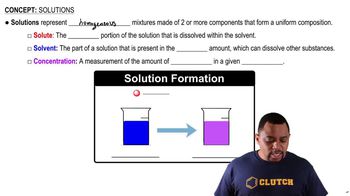
Volatile solutes have significant vapor pressures and can evaporate easily, while nonvolatile solutes have negligible vapor pressures and do not contribute to the vapor phase. In a solution, the presence of a nonvolatile solute will lower the vapor pressure more than a volatile solute at the same concentration, affecting the phase behavior and boiling point of the solution. Understanding these differences is essential for interpreting phase diagrams.
Video consigliato:
Percorso guidato
01:39
Solution Components