Ch.14 - Chemical Kinetics
McMurry - Chemistry 8th Edition
McMurry8th EditionChemistryISBN: 9781292336145Non è quello che usi tu?Cambia libro di testo
Capitolo 14, Problema 1

Use the following equation and graph to answer questions 1 and 2. Hydrogen iodide decomposes at 410 °C, according the reaction: 2 HI1g2¡H21g2 + I21g2 The graph shows how the concentration of HI changes over time. What is the average rate of loss of HI over the time period 0–40 s (LO 14.1) (a) 7.5 * 10-3 M>s (b) 4.8 * 10-3 M>s (c) 3.0 * 10-2 M>s (d) 3.5 * 10-3 M>s

Guida verificata passo dopo passo
1
Identify the initial and final concentrations of HI from the graph at time 0 s and 40 s.
Calculate the change in concentration of HI by subtracting the final concentration from the initial concentration.
Determine the time interval over which the change occurs, which is from 0 s to 40 s.
Use the formula for average rate of reaction: \( \text{Average Rate} = \frac{\Delta [\text{HI}]}{\Delta t} \), where \( \Delta [\text{HI}] \) is the change in concentration and \( \Delta t \) is the change in time.
Substitute the values obtained from the graph into the formula to calculate the average rate of loss of HI.

Risposta video verificata per un problema simile:

Questa soluzione video è stata consigliata dai nostri tutor come utile per risolvere questo problema.
Durata del video:
2m

Concetti chiave

Ecco i concetti essenziali che devi comprendere per rispondere correttamente alla domanda.

Reaction Rate

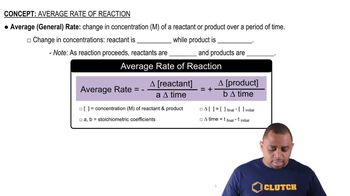
The reaction rate refers to the speed at which reactants are converted into products in a chemical reaction. It is typically expressed as the change in concentration of a reactant or product per unit time, often in molarity per second (M/s). Understanding how to calculate the average rate of a reaction over a specific time interval is crucial for analyzing chemical kinetics.
Video consigliato:
Percorso guidato
02:03
Average Rate of Reaction

Concentration Change

Concentration change is the difference in the amount of a substance in a given volume over time. In the context of the provided reaction, it involves measuring how the concentration of hydrogen iodide (HI) decreases as it decomposes into hydrogen (H2) and iodine (I2). This change is essential for determining the average rate of loss of HI during the specified time period.
Video consigliato:
Percorso guidato
01:53
Chemical Changes

Graph Interpretation

Graph interpretation involves analyzing graphical data to extract meaningful information. In this case, the graph shows the concentration of HI over time, allowing one to visually assess how the concentration changes. Understanding how to read and interpret the graph is vital for accurately calculating the average rate of loss of HI during the specified time interval.
Video consigliato:
Percorso guidato
03:13
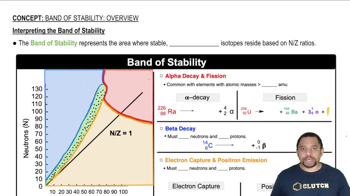
Intepreting the Band of Stability