Ch.17 - Applications of Aqueous Equilibria
McMurry - Chemistry 8th Edition
McMurry8th EditionChemistryISBN: 9781292336145Non è quello che usi tu?Cambia libro di testo
Capitolo 17, Problema 41c

The following plot shows two pH titration curves, each representing the titration of 50.0 mL of 0.100 M acid with 0.100 M NaOH:
Graph showing pH titration curves for strong and weak acids with NaOH.
. (c) What is the approximate pKa of the weak acid?

Guida verificata passo dopo passo
1
Identify the titration curve corresponding to the weak acid. This is the curve that starts at a higher initial pH and has a more gradual slope before the equivalence point.
Locate the equivalence point on the titration curve of the weak acid. This is the point where the pH rapidly increases, indicating that the amount of NaOH added is stoichiometrically equivalent to the amount of weak acid present.
Determine the volume of NaOH added at the equivalence point. This is the volume at which the steepest part of the curve occurs.
Find the half-equivalence point, which is the point where half of the volume of NaOH needed to reach the equivalence point has been added. This is the midpoint of the buffer region on the titration curve.
Read the pH value at the half-equivalence point. The pH at this point is equal to the pKa of the weak acid.

Risposta video verificata per un problema simile:

Questa soluzione video è stata consigliata dai nostri tutor come utile per risolvere questo problema.
Durata del video:
5m

Concetti chiave

Ecco i concetti essenziali che devi comprendere per rispondere correttamente alla domanda.

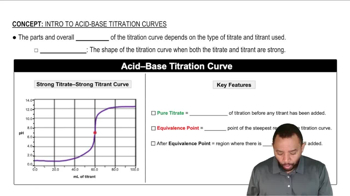
Titration Curves

Titration curves graphically represent the change in pH of a solution as a titrant is added. In this case, the curves show the titration of a strong base (NaOH) with a weak acid. The shape of the curve indicates the buffering region and the equivalence point, where the amount of acid equals the amount of base added.
Video consigliato:
Percorso guidato
02:16
Acid-Base Titration Curves

pKa and Acid Strength

The pKa value is a measure of the strength of an acid in solution, defined as the negative logarithm of the acid dissociation constant (Ka). For weak acids, the pKa is typically found at the midpoint of the steepest part of the titration curve, where half of the acid has been neutralized, indicating the concentration of the acid equals that of its conjugate base.
Video consigliato:
Percorso guidato
03:51
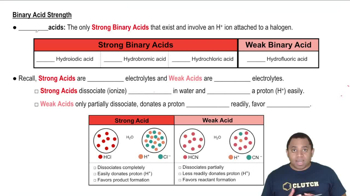
Binary Acid Strengths

Equivalence Point

The equivalence point in a titration is reached when the amount of titrant added is stoichiometrically equivalent to the amount of substance being titrated. For weak acids, this point is characterized by a rapid change in pH, and it is crucial for determining the pKa, as it indicates the complete neutralization of the acid by the base.
Video consigliato:
Percorso guidato
01:07
At the Equivalence Point
Pratica correlata
Domanda del libro di testo

The following plot shows two pH titration curves, each representing the titration of 50.0 mL of 0.100 M acid with 0.100 M NaOH:

. (b) What is the approximate pH at the equivalence point for each of the acids?

967
views
Domanda del libro di testo

The following pictures represent solutions at various stages in the titration of a weak base B with aqueous HCl. (Cl- ions and solvent water molecules have been omitted for clarity.)

. (b) Is the pH at the equivalence point more or less than 7?

595
views
Domanda del libro di testo

The following pictures represent solutions that contain one or more of the compounds H2A, NaHA, and Na2A, where H2A is a weak diprotic acid. (Na+ ions and solvent water molecules have been omitted for clarity.)

(b) Which solution has the greatest buffer capacity?

815
views
Domanda del libro di testo
The following pictures represent solutions at various stages in the titration of a weak diprotic acid H2A with aqueous NaOH. (Na+ ions and water molecules have been omitted for clarity.)

. (b) Which solution has the highest pH? Which has the lowest pH?
378
views
Domanda del libro di testo

The following pictures represent solutions at various stages in the titration of a weak base B with aqueous HCl. (Cl- ions and solvent water molecules have been omitted for clarity.)

. (a) To which of the following stages do solutions 1–4 correspond? (i) The initial solution before addition of any HCl (ii) Halfway to the equivalence point (iii) At the equivalence point (iv) Beyond the equivalence point

809
views
Domanda del libro di testo

The following plot shows two pH titration curves, each representing the titration of 50.0 mL of 0.100 M acid with 0.100 M NaOH:

. (a) Which of the two curves represents the titration of a strong acid? Which represents a weak acid?

800
views