
Nitrogen has a normal boiling point of 77.3 K and a melting point (at 1 atm) of 63.1 K. Its critical temperature is 126.2 K and its critical pressure is 2.55×10⁴ torr. It has a triple point at 63.1 K and 94.0 torr. Sketch the phase diagram for nitrogen. Does nitrogen have a stable liquid state at 1 atm?
Ch.12 - Liquids, Solids & Intermolecular Forces

Tro6th EditionChemistry: A Molecular ApproachISBN: 9780137832217Non è quello che usi tu?Cambia libro di testo
Capitolo 12, Problema 82
Argon has a normal boiling point of 87.2 K and a melting point (at 1 atm) of 84.1 K. Its critical temperature is 150.8 K and its critical pressure is 48.3 atm. It has a triple point at 83.7 K and 0.68 atm. Sketch the phase diagram for argon. Which has the greater density, solid argon or liquid argon?
Guida verificata passo dopo passo1
Identify the key points for the phase diagram: the triple point (83.7 K, 0.68 atm), the normal boiling point (87.2 K, 1 atm), the melting point (84.1 K, 1 atm), and the critical point (150.8 K, 48.3 atm).
Draw the axes for the phase diagram with pressure on the y-axis and temperature on the x-axis.
Plot the triple point, normal boiling point, melting point, and critical point on the diagram.
Draw the phase boundaries: the line from the triple point to the melting point represents the solid-liquid equilibrium, the line from the triple point to the normal boiling point represents the solid-gas equilibrium, and the line from the normal boiling point to the critical point represents the liquid-gas equilibrium.
To determine which phase has greater density, consider that typically, the solid phase is denser than the liquid phase, but for some substances like water, the liquid phase can be denser. Compare the slopes of the solid-liquid equilibrium line to infer density differences.

Risposta video verificata per un problema simile:
Questa soluzione video è stata consigliata dai nostri tutor come utile per risolvere questo problema.
Durata del video:
6mConcetti chiave
Ecco i concetti essenziali che devi comprendere per rispondere correttamente alla domanda.
Phase Diagram
A phase diagram is a graphical representation that shows the states of a substance (solid, liquid, gas) at various temperatures and pressures. It includes key points such as the melting point, boiling point, critical point, and triple point, which indicate the conditions under which different phases coexist. Understanding how to read and interpret a phase diagram is essential for analyzing the behavior of substances under varying conditions.
Video consigliato:
Percorso guidato
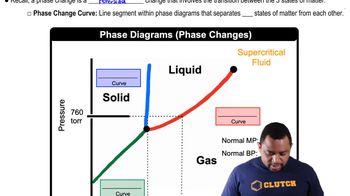
Phase Changes in Diagrams
Density of Phases
Density is defined as mass per unit volume and varies between different phases of a substance. Generally, solids are denser than liquids due to their closely packed molecular structure. In the case of argon, comparing the densities of solid and liquid phases involves understanding how temperature and pressure affect molecular arrangement and spacing, which is crucial for determining which phase has greater density.
Video consigliato:
Percorso guidato
Phases
Triple Point
The triple point of a substance is the unique set of conditions at which all three phases (solid, liquid, and gas) coexist in equilibrium. For argon, the triple point occurs at 83.7 K and 0.68 atm, indicating the specific temperature and pressure where solid, liquid, and gaseous argon can exist simultaneously. This concept is vital for understanding phase transitions and the stability of different states of matter.
Video consigliato:
Percorso guidato
Boiling Point Elevation
Pratica correlata
Domanda del libro di testo
2550
views
Domanda del libro di testo
Consider the phase diagram shown here. Identify the states present at points a through g.
1221
views
Domanda del libro di testo
The phase diagram for sulfur is shown here. The rhombic and monoclinic states are two solid states with different structures. b. Which of the two solid states of sulfur is more dense?
525
views
Domanda del libro di testo
How much ice (in grams) would have to melt to absorb 155 kJ of energy?
Domanda del libro di testo
The phase diagram for sulfur is shown here. The rhombic and monoclinic states are two solid states with different structures. a. Below what pressure does solid sulfur sublime?
1586
views
