
A 25.0-mL sample of 0.125 M pyridine is titrated with 0.100 M HCl. Calculate the pH at each volume of added acid: 0 mL, 10 mL, 20 mL, equivalence point, one-half equivalence point, 40 mL, 50 mL. Sketch the titration curve.
Ch.18 - Aqueous Ionic Equilibrium

Tro6th EditionChemistry: A Molecular ApproachISBN: 9780137832217Non è quello che usi tu?Cambia libro di testo
Capitolo 18, Problema 82
Consider the titration curves (labeled a and b) for two weak bases, both titrated with 0.100 M HCl. (a)

(b)
![]()
(ii) Which base has the larger Kb?
Guida verificata passo dopo passo1
Identify the initial pH of both titration curves. The initial pH is higher for the base with the larger Kb.
Observe the shape of the titration curves. The curve with a more gradual slope before the equivalence point indicates a weaker base.
Determine the volume of HCl added at the equivalence point for both curves. The equivalence point occurs where the pH drops sharply.
Compare the pH at the equivalence point for both curves. The base with the higher pH at the equivalence point has a larger Kb.
Conclude which base has the larger Kb by comparing the initial pH and the pH at the equivalence point for both titration curves.

Risposta video verificata per un problema simile:
Questa soluzione video è stata consigliata dai nostri tutor come utile per risolvere questo problema.
Durata del video:
2mConcetti chiave
Ecco i concetti essenziali che devi comprendere per rispondere correttamente alla domanda.
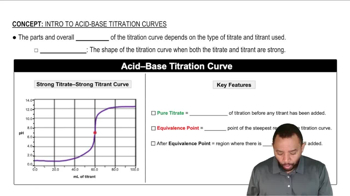
Titration Curves
Titration curves graphically represent the change in pH of a solution as a titrant is added. In this case, the weak bases are being titrated with a strong acid (HCl), leading to a characteristic S-shaped curve. The steepest part of the curve indicates the equivalence point, where the amount of acid equals the amount of base present, and the pH changes rapidly.
Video consigliato:
Percorso guidato
Acid-Base Titration Curves
Weak Base and Kb
Weak bases partially dissociate in solution, establishing an equilibrium between the base and its conjugate acid. The base dissociation constant (Kb) quantifies this equilibrium, with larger Kb values indicating a stronger weak base that dissociates more in solution. Comparing the titration curves can help determine which base has a larger Kb based on the steepness and position of the pH change.
Video consigliato:
Percorso guidato
ICE Charts of Weak Bases
Equivalence Point
The equivalence point in a titration is reached when the amount of titrant added is stoichiometrically equivalent to the amount of substance being titrated. For weak bases titrated with a strong acid, this point is characterized by a significant drop in pH. Analyzing the pH at the equivalence point can provide insights into the strength of the base and its Kb value.
Video consigliato:
Percorso guidato
At the Equivalence Point
Pratica correlata
Domanda del libro di testo
294
views
Domanda del libro di testo
A 0.229-g sample of an unknown monoprotic acid is titrated with 0.112 M NaOH. The resulting titration curve is shown here. Determine the molar mass and pKa of the acid.
3114
views
Domanda del libro di testo
Consider the titration curves (labeled a and b) for two weak acids, both titrated with 0.100 M NaOH.
(i) Which acid solution is more concentrated?
1496
views
Domanda del libro di testo
Consider the titration curves (labeled a and b) for two weak acids, both titrated with 0.100 M NaOH.
(ii) Which acid has the larger Ka?
895
views
Domanda del libro di testo
A 20.0-mL sample of 0.115 M sulfurous acid (H2SO3) solution is titrated with 0.1014 M KOH. At what added volume of base solution does each equivalence point occur?
1619
views
