Ch. 5 - Chromosome Mapping in Eukaryotes
Klug - Concepts of Genetics 12th Edition
Klug12th EditionConcepts of GeneticsISBN: 9780135564776Non è quello che usi tu?Cambia libro di testo
Capitolo 5, Problema 26

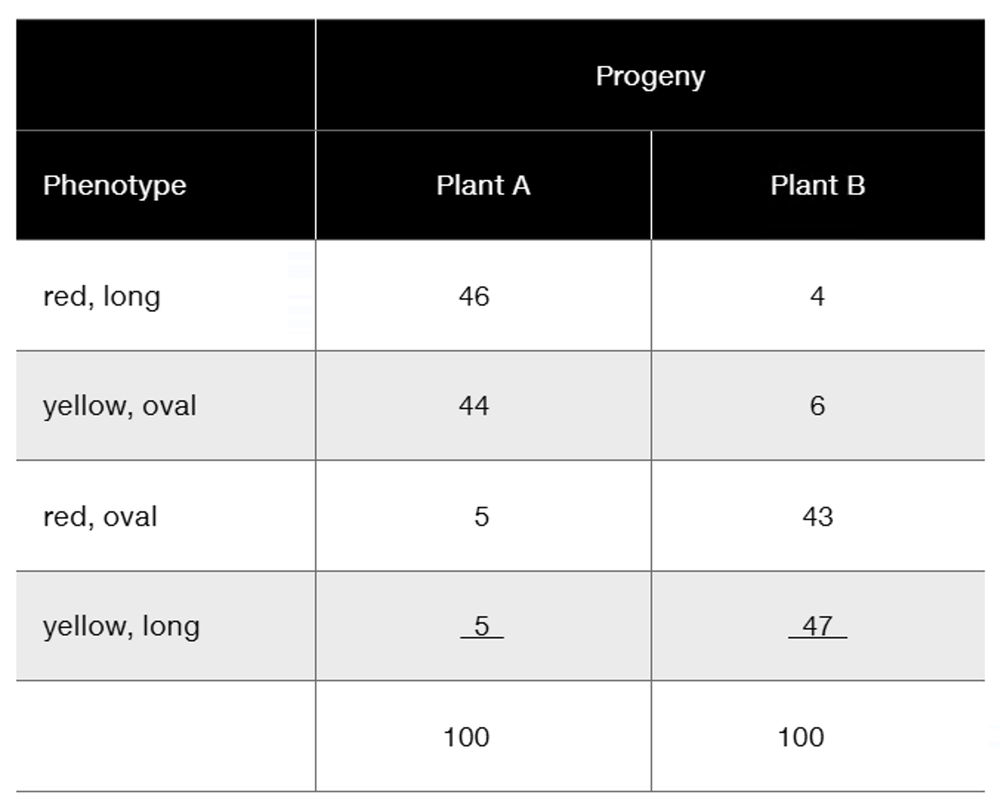
In a certain plant, fruit is either red or yellow, and fruit shape is either oval or long. Red and oval are the dominant traits. Two plants, both heterozygous for these traits, were testcrossed, with the following results.
Table showing progeny counts for two heterozygous plants testcrossed, with phenotypes red/long, yellow/oval, red/oval, and yellow/long.
Determine the location of the genes relative to one another and the genotypes of the two parental plants.

Guida verificata passo dopo passo
1
Step 1: Identify the parental genotypes and phenotypes. Both plants are heterozygous for fruit color (Red is dominant to Yellow) and fruit shape (Oval is dominant to Long). So, the parental genotypes are likely RrOo, where R = red, r = yellow, O = oval, and o = long.
Step 2: Analyze the progeny phenotypes and their counts from the testcross. The testcross involves crossing the heterozygous plants (RrOo) with homozygous recessive plants (rroo). The progeny phenotypes are red/long, yellow/oval, red/oval, and yellow/long with their respective counts for Plant A and Plant B.
Step 3: Determine which phenotypes represent parental (non-recombinant) and recombinant types. The most frequent phenotypes correspond to parental types, while the least frequent correspond to recombinants. For Plant A, red/long and yellow/oval are most frequent, so these are parental; red/oval and yellow/long are recombinant. For Plant B, red/oval and yellow/long are most frequent, so these are parental; red/long and yellow/oval are recombinant.
Step 4: Calculate the recombination frequency (RF) for each plant using the formula: \(\text{RF} = \frac{\text{Number of recombinant progeny}}{\text{Total progeny}} \times 100\). For Plant A, sum the recombinant progeny counts (red/oval + yellow/long) and divide by total progeny (100). Repeat for Plant B.
Step 5: Interpret the recombination frequency to determine gene linkage and relative gene location. A recombination frequency less than 50% indicates that the genes are linked and close on the same chromosome. The parental genotypes can be deduced based on which allele combinations are inherited together (coupling or repulsion phase).

Risposta video verificata per un problema simile:

Questa soluzione video è stata consigliata dai nostri tutor come utile per risolvere questo problema.
Durata del video:
55s

Concetti chiave

Ecco i concetti essenziali che devi comprendere per rispondere correttamente alla domanda.

Testcross and Its Purpose

A testcross involves crossing an individual with a homozygous recessive individual to determine the genotype of the former. It reveals whether the tested individual is heterozygous or homozygous dominant for specific traits by analyzing the phenotypes of the offspring. This method is essential for mapping gene linkage and recombination.
Video consigliato:
Percorso guidato
00:52
Purpose of X Inactivation

Gene Linkage and Recombination

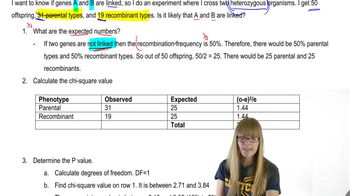
Genes located close together on the same chromosome tend to be inherited together, a phenomenon called linkage. Recombination occurs when crossing over during meiosis exchanges genetic material between homologous chromosomes, producing new allele combinations. The frequency of recombinant offspring helps determine the physical distance between genes.
Video consigliato:
Percorso guidato
07:33
Chi Square and Linkage

Dominant and Recessive Traits and Phenotypic Ratios

Dominant traits mask the expression of recessive traits in heterozygotes. In this problem, red and oval are dominant, while yellow and long are recessive. Analyzing the phenotypic ratios of progeny from heterozygous parents helps infer parental genotypes and gene linkage, especially when deviations from expected Mendelian ratios occur.
Video consigliato:
Percorso guidato
13:40
Traits and Variance
Pratica correlata
Domanda del libro di testo

Traditional gene mapping has been applied successfully to a variety of organisms including yeast, fungi, maize, and Drosophila. However, human gene mapping has only recently shared a similar spotlight. What factors have delayed the application of traditional gene-mapping techniques in humans?

542
views
Domanda del libro di testo

Based on our discussion of the potential inaccuracy of mapping, would you revise your answer to Problem 22? If so, how?

637
views
Domanda del libro di testo

Two plants in a cross were each heterozygous for two gene pairs (Ab/aB) whose loci are linked and 25 mu apart. Assuming that crossing over occurs during the formation of both male and female gametes and that the A and B alleles are dominant, determine the phenotypic ratio of their offspring.

1226
views
Domanda del libro di testo

A female of genotype

produces 100 meiotic tetrads. Of these, 68 show no crossover events. Of the remaining 32, 20 show a crossover between a and b, 10 show a crossover between b and c, and 2 show a double crossover between a and b and between b and c. Of the 400 gametes produced, how many of each of the 8 different genotypes will be produced? Assuming the order a–b–c and the allele arrangement previously shown, what is the map distance between these loci?

827
views
Domanda del libro di testo

DNA markers have greatly enhanced the mapping of genes in humans. What are DNA markers, and what advantage do they confer?

774
views
Domanda del libro di testo

A number of human–mouse somatic cell hybrid clones were examined for the expression of specific human genes and the presence of human chromosomes. The results are summarized in the following table. Assign each gene to the chromosome on which it is located.

988
views