Skip to main content
Intermediate Algebra
Il mio corso
Impara
Preparazione agli esami
AI Tutor
Guide di studio
Flashcard
Esplora
Prova l'app
Il mio corso
Impara
Preparazione agli esami
AI Tutor
Guide di studio
Flashcard
Esplora
Prova l'app
Indietro
Systems of Linear Inequalities quiz
Puoi toccare per girare la carta.
What is the first step when graphing a system of linear inequalities?
Puoi toccare per girare la carta.
👆
What is the first step when graphing a system of linear inequalities?
The first step is to graph each inequality's boundary line, using a solid line for ≤ or ≥ and a dashed line for < or >.
Avanzamenti del tracciato
I pulsanti di controllo sono stati cambiati in modalità "navigazione".
1/15
Flashcard correlate
Pratica correlata
Video consigliati
Systems of Linear Inequalities definitions
Systems of Linear Inequalities
15 Termini
Systems of Linear Inequalities
5. Systems of Linear Equations
5 Problemi
Argomento
JustinRaimundo
Solving Systems of Linear Equations by Elimination
5. Systems of Linear Equations
5 Problemi
Argomento
AllySteele
5. Systems of Linear Equations
3 Argomenti
9 Problemi
Capitolo
AllySteele
VideoThumbView.guidedCourse
06:26
Graphing Systems of Linear Inequalities
157
views
5
rank
VideoThumbView.guidedCourse
06:50
Graphing Systems of Linear Inequalities Example 1
116
views
2
rank
Termini in questo insieme (15)
Nascondere definizioni
What is the first step when graphing a system of linear inequalities?
The first step is to graph each inequality's boundary line, using a solid line for ≤ or ≥ and a dashed line for < or >.
How do you determine whether to use a solid or dashed line when graphing an inequality?
Use a solid line for inequalities with ≤ or ≥, and a dashed line for < or >.
What is the purpose of using a test point when graphing inequalities?
A test point helps determine which side of the boundary line to shade by checking if the point satisfies the inequality.
Which test point is commonly used when graphing inequalities, and why?
The point (0,0) is commonly used because it is easy to substitute and usually not on the boundary line.
What does the overlapping shaded region represent in a system of inequalities?
The overlapping shaded region is the solution set that satisfies all inequalities in the system simultaneously.
What should you do if your test point makes the inequality true?
If the test point makes the inequality true, shade the side of the line that includes the test point.
What should you do if your test point makes the inequality false?
If the test point makes the inequality false, shade the side of the line that does not include the test point.
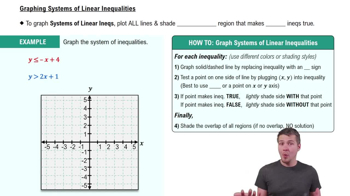
How do you graph the line for the inequality y ≤ -x + 4?
Graph a solid line through the y-intercept at 4 with a slope of -1.
How do you graph the line for the inequality y > 2x + 1?
Graph a dashed line through the y-intercept at 1 with a slope of 2.
What do you do after shading the regions for each inequality in a system?
After shading, identify and highlight the region where all shaded areas overlap; this is the solution.
What does it mean if there is no overlapping region when graphing a system of inequalities?
It means there is no solution to the system because no region satisfies all inequalities at once.
Why is it helpful to use different colors or shading styles when graphing systems of inequalities?
Different colors or shading styles make it easier to see where the solution regions overlap.
What form should a linear inequality be in to make graphing easier?
It should be in slope-intercept form (y = mx + b) to easily identify the slope and y-intercept.
What is the main difference between solving systems of equations and systems of inequalities?
Systems of equations can be solved algebraically or graphically, but systems of inequalities are typically solved by graphing.
What should you do if the test point lies on the boundary line?
Choose a different test point that is not on the boundary line to avoid ambiguity in shading.
 IndietroIndietro

 06:26
06:26