Skip to main content
Macroeconomics
Il mio corso
Impara
Preparazione agli esami
AI Tutor
Guide di studio
Flashcard
Esplora
Prova l'app
Il mio corso
Impara
Preparazione agli esami
AI Tutor
Guide di studio
Flashcard
Esplora
Prova l'app
Indietro
Monopolistic Competition Profit on the Graph definitions
Puoi toccare per girare la carta.
Monopolistic Competition
Puoi toccare per girare la carta.
👆
Monopolistic Competition
A market structure with many firms selling differentiated products and facing downward-sloping demand curves.
Avanzamenti del tracciato
I pulsanti di controllo sono stati cambiati in modalità "navigazione".
1/13
Flashcard correlate
Video consigliati
Monopolistic Competition Profit on the Graph quiz
Monopolistic Competition Profit on the Graph
15 Termini
VideoThumbView.guidedCourse
07:07
Monopolistic Competition Profit on the Graph
4
views
Termini in questo insieme (13)
Nascondere definizioni
Monopolistic Competition
A market structure with many firms selling differentiated products and facing downward-sloping demand curves.
Profit Maximizing Quantity
The output level where marginal revenue equals marginal cost, ensuring the highest possible profit or smallest loss.
Marginal Revenue
The additional income from selling one more unit, always less than the price in this market structure.
Marginal Cost
The extra expense incurred from producing one additional unit, crucial for determining optimal output.
Demand Curve
A graphical representation showing the relationship between price and quantity demanded for a firm's product.
Average Total Cost
The per-unit expense of production, found by dividing total costs by output, used to assess profit or loss.
Profit
The area between price and average total cost, multiplied by quantity, when price exceeds average total cost.
Loss
The area between average total cost and price, multiplied by quantity, when average total cost exceeds price.
Loss Minimizing Quantity
The output where marginal revenue equals marginal cost, resulting in the smallest possible loss for the firm.
Price
The amount received for each unit sold, determined by the demand curve at the profit-maximizing output.
Graph
A visual tool displaying curves such as demand, marginal revenue, marginal cost, and average total cost for analysis.
Rectangle Area
The visual representation of profit or loss on a graph, calculated by the difference between price and average total cost times quantity.
Perfect Competition
A benchmark market structure where firms are price takers and marginal revenue equals price.
 IndietroIndietro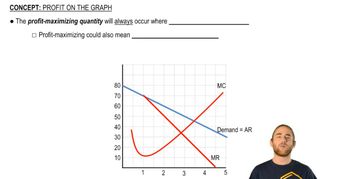
 07:07
07:07