Skip to main content
Macroeconomics
Il mio corso
Impara
Preparazione agli esami
AI Tutor
Guide di studio
Flashcard
Esplora
Prova l'app
Il mio corso
Impara
Preparazione agli esami
AI Tutor
Guide di studio
Flashcard
Esplora
Prova l'app
Indietro
Supply and Demand Together: Both Shift quiz
Puoi toccare per girare la carta.
What happens to one of the variables (price or quantity) when both supply and demand curves shift on the same graph?
Puoi toccare per girare la carta.
👆
What happens to one of the variables (price or quantity) when both supply and demand curves shift on the same graph?
One of the variables becomes ambiguous, meaning we cannot definitively determine if it increases or decreases.
Avanzamenti del tracciato
I pulsanti di controllo sono stati cambiati in modalità "navigazione".
1/15
Flashcard correlate
Pratica correlata
Video consigliati
Supply and Demand Together: Both Shift definitions
Supply and Demand Together: Both Shift
15 Termini
Supply and Demand Together: Both Shift
3. Supply and Demand
10 Problemi
Argomento
Supply and Demand: Quantitative Analysis
3. Supply and Demand
5 Problemi
Argomento
3. Supply and Demand - Part 1 of 2
11 Argomenti
15 Problemi
Capitolo
3. Supply and Demand - Part 2 of 2
1 Argomento
3 Problemi
Capitolo
VideoThumbView.guidedCourse
06:34
Results of Both Shifting
2698
views
27
rank
VideoThumbView.guidedCourse
07:32
Shift in Both Supply and Demand
3441
views
39
rank
1
comments
Termini in questo insieme (15)
Nascondere definizioni
What happens to one of the variables (price or quantity) when both supply and demand curves shift on the same graph?
One of the variables becomes ambiguous, meaning we cannot definitively determine if it increases or decreases.
Why is it important to shift both supply and demand curves equally when analyzing double shifts?
Shifting both curves equally helps minimize ambiguity and makes it easier to identify which variable is ambiguous.
What shape should you aim to form when shifting both supply and demand curves equally?
You should aim to form a square shape between the shifts for clarity in analysis.
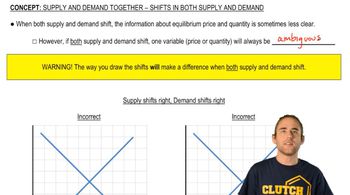
When both supply and demand shift to the right, what happens to equilibrium quantity and price?
Equilibrium quantity clearly increases, but the change in price is ambiguous.
When both supply and demand shift to the left, what happens to equilibrium quantity and price?
Equilibrium quantity clearly decreases, but the change in price is ambiguous.
If supply shifts left and demand shifts right, which variable is ambiguous and which is clear?
Quantity is ambiguous, but price clearly increases.
If supply shifts right and demand shifts left, which variable is ambiguous and which is clear?
Quantity is ambiguous, but price clearly decreases.
What is the best method to analyze the effects of simultaneous shifts in supply and demand?
Using graphical analysis is the most reliable method.
How can you check if you shifted both curves equally on your graph?
You should see a square shape formed between the new and original curves.
What notation might teachers use to indicate an ambiguous variable in double shift problems?
Teachers might use a question mark (e.g., p?) or a double-sided arrow to indicate ambiguity.
What happens to price when supply and demand both shift in the same direction?
Price becomes the ambiguous variable.
What happens to quantity when supply and demand shift in opposite directions?
Quantity becomes the ambiguous variable.
Why do different answers for price occur when shifting supply and demand by different amounts?
Because the relative size of the shifts affects the new equilibrium, making price ambiguous.
What is the main pattern to remember when both supply and demand shift together?
When both shift the same way, quantity is clear and price is ambiguous; when they shift oppositely, price is clear and quantity is ambiguous.
What should you always do to avoid mistakes when analyzing double shifts?
Draw the shifts on a graph and analyze the new equilibrium points.
 IndietroIndietro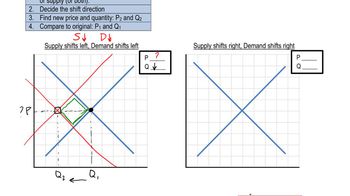
 06:34
06:34