Skip to main content
Macroeconomics
Il mio corso
Impara
Preparazione agli esami
AI Tutor
Guide di studio
Flashcard
Esplora
Prova l'app
Il mio corso
Impara
Preparazione agli esami
AI Tutor
Guide di studio
Flashcard
Esplora
Prova l'app
Indietro
The Saving Function quiz
Puoi toccare per girare la carta.
What does the savings function relate to?
Puoi toccare per girare la carta.
👆
What does the savings function relate to?
The savings function relates household savings to the level of disposable income.
Avanzamenti del tracciato
I pulsanti di controllo sono stati cambiati in modalità "navigazione".
1/15
Flashcard correlate
Pratica correlata
Video consigliati
The Saving Function definitions
The Saving Function
15 Termini
The Saving Function
14. Income and Consumption
10 Problemi
Argomento
Determinants of Consumption and Saving
14. Income and Consumption
10 Problemi
Argomento
15. Income and Consumption
5 Argomenti
15 Problemi
Capitolo
VideoThumbView.guidedCourse
06:14
Saving Function (Saving Schedule)
1558
views
26
rank
Termini in questo insieme (15)
Nascondere definizioni
What does the savings function relate to?
The savings function relates household savings to the level of disposable income.
What is disposable income used for?
Disposable income is used for either consumption or savings after taxes are paid.
What typically happens to savings when disposable income increases?
When disposable income increases, both consumption and savings typically increase.
What does the 45-degree line on the savings function graph represent?
The 45-degree line represents a scenario where all disposable income is saved.
Why does the actual savings function lie below the 45-degree line?
It lies below the 45-degree line because not all disposable income is saved; some is consumed.
At what point on the savings function graph is all disposable income saved?
At the point where the savings function intersects the 45-degree line, all disposable income is saved.
What does a point below the 45-degree line on the savings function graph indicate?
It indicates that only a portion of disposable income is being saved, with the rest consumed.
What is the Marginal Propensity to Save (MPS)?
MPS is the amount by which savings increase when disposable income increases by one unit.
How is the MPS calculated?
MPS is calculated as the change in savings divided by the change in disposable income.
What does the slope of the savings function represent?
The slope of the savings function represents the Marginal Propensity to Save (MPS).
Is the MPS generally larger or smaller than the Marginal Propensity to Consume (MPC)?
The MPS is generally smaller than the MPC because people tend to consume more of their extra income.
What happens to savings and consumption when you receive a bonus or raise?
Both savings and consumption are likely to increase when you receive a bonus or raise.
What does a shallow savings function indicate about saving behavior?
A shallow savings function indicates that only a small portion of additional income is saved.
What does a point on the savings function graph where savings exceed disposable income imply?
It implies an unrealistic scenario where more is saved than earned, which generally does not make sense.
What is the formula for the Marginal Propensity to Consume (MPC)?
The MPC is the change in consumption divided by the change in disposable income.
 IndietroIndietro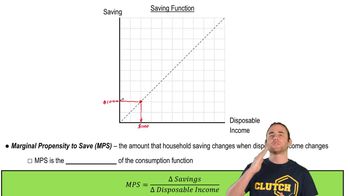
 06:14
06:14