 Indietro
Microeconomics Key Concepts and Formulas
 01:42
01:42

Termini in questo insieme (20)
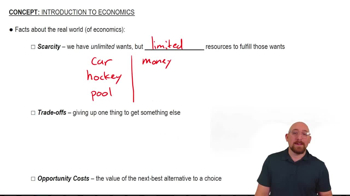
Opportunity cost is the next-best alternative you give up when making a choice.
When price increases, quantity demanded decreases, and vice versa. This is a movement along the demand curve.
Own price change causes movement along the curve; other factors cause the entire demand curve to shift.
Normal goods: Income ↑ → Demand ↑. Inferior goods: Income ↑ → Demand ↓.
Goods used instead of each other. If price of one falls, demand for the other decreases.
Goods usually bought together. If price of one rises, demand for the other decreases.
When price increases, quantity supplied increases, and vice versa. This is a movement along the supply curve.
Include input prices, technology, prices of related goods, number of producers, and expectations.
Occurs where quantity demanded equals quantity supplied (Qd = Qs), setting the equilibrium price and quantity.
Shortage: Qd > Qs, price below equilibrium.
Surplus: Qs > Qd, price above equilibrium.
Difference between what buyers are willing to pay and what they actually pay: \(CS = \text{Willingness to Pay} - \text{Market Price}\).
Difference between market price and minimum price sellers are willing to accept: \(PS = \text{Market Price} - \text{Minimum Acceptable Price}\).
Measures responsiveness of quantity demanded to price changes: \(PED = \frac{\% \Delta Q_d}{\% \Delta P}\).
% Change in Quantity = (New Q − Old Q) ÷ [(New Q + Old Q) ÷ 2]; similarly for price.
Elastic: |PED| > 1; Inelastic: |PED| < 1; Unit elastic: |PED| = 1.
A 1% increase in price causes quantity demanded to decrease by 3%, showing high responsiveness.
Luxuries, more substitutes, and longer time horizons make demand more elastic.
Demand curve is vertical; quantity demanded does not change with price changes.
Measures responsiveness of quantity supplied to price changes: \(PES = \frac{\% \Delta Q_s}{\% \Delta P}\).
Total Revenue = Price × Quantity. If demand is elastic, price ↑ → revenue ↓; if inelastic, price ↑ → revenue ↑.