 Indietro
Chapter 1 Introduction to Microeconomics: Key Concepts and Graphical Analysis
Guida di studio - Note intelligenti
 Appunti personalizzati basati sui tuoi materiali, ampliati con definizioni chiave, esempi e contesto.
What is Economics?
Definition of Economics
Economics is the study of how individuals and societies allocate scarce resources to satisfy unlimited wants. Because resources are limited, all economic questions arise from the problem of scarcity, which forces people to make choices.
Scarcity: The fundamental economic problem of having seemingly unlimited human wants in a world of limited resources.
Choices: Decisions made to allocate resources efficiently due to scarcity.
Example: Scarcity applies to all countries, regardless of their level of development.
Microeconomics vs. Macroeconomics
Economics is divided into two main branches:
Microeconomics: The study of choices made by individuals and businesses, and how these choices interact in markets.
Macroeconomics: The study of the economy as a whole, including issues like inflation, unemployment, and economic growth.
Examples of Microeconomic Topics: Why a consumer buys less honey, or how an increase in gas prices affects consumer behavior.
Two Big Economic Questions
What, How, and For Whom?
Economics seeks to answer two fundamental questions:
How do choices determine what, how, and for whom goods and services are produced?
When do choices made in self-interest also promote the social interest?
Factors of Production: Land, labor, capital, and entrepreneurship are organized to produce goods and services. Entrepreneurs earn profit, labor earns wages, land earns rent, and capital earns interest.
The Economic Way of Thinking
Opportunity Cost
The opportunity cost of an action is the highest-valued alternative that must be given up to take that action.
Example: The opportunity cost of attending university includes forgone income and other alternatives.
Example: Choosing to travel in Europe instead of working a summer job means giving up the job's income and incurring travel expenses.
Marginal Analysis
Decisions are often made at the margin, weighing the additional (marginal) benefit against the additional (marginal) cost.
Marginal Benefit: The benefit from an incremental increase in an activity.
Marginal Cost: The opportunity cost of an incremental increase in an activity.
Rational Choice: If marginal benefit exceeds marginal cost, the activity should be increased.
Positive vs. Normative Statements
Economic statements can be classified as:
Positive Statements: Statements that can be tested and validated (e.g., "If the price of gasoline rises, people will drive less").
Normative Statements: Statements that express opinions or what ought to be (e.g., "Greece is the best place to vacation").
Self-Interest and Social Interest
Economic decisions are often motivated by self-interest, but they can also promote the social interest. For example, a company's expansion may benefit both itself and society by creating jobs or offering new products.
Graphing in Economics
Economic Variables and Relationships
Economic models use variables such as price (P), quantity (Q), cost (C), labor (L), capital (K), and profit to describe relationships. These relationships can be expressed in words, symbols, equations, or graphs.
Types of Graphical Relationships
Variables move in the same direction (positive relationship).
Variables move in opposite directions (negative relationship).
Variables have a maximum or minimum.
Variables are unrelated.
The Slope of a Relationship
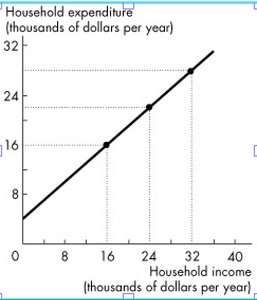
The slope measures how one variable changes in relation to another. For a straight line, the slope is constant and calculated as "rise over run." For a curve, the slope at a point is the slope of the tangent at that point.
Formula for Slope:
A positive slope indicates an upward-sloping line; a negative slope indicates a downward-sloping line.
Example: Calculating Slope
Given a line where household expenditure increases with household income, the slope can be calculated using two points on the line.
Equation of a Line
The relationship between two variables can be described by a linear equation, such as:
Summary Table: Factors of Production and Their Earnings
Factor of Production | Income Earned |
|---|---|
Land | Rent |
Labor | Wages |
Capital | Interest |
Entrepreneurship | Profit |
