Ch 19: The First Law of Thermodynamics
Young & Freedman Calc - University Physics 14th Edition
Young & Freedman Calc14th EditionUniversity PhysicsISBN: 9780321973610Non è quello che usi tu?Cambia libro di testo
Capitolo 19, Problema 1a

Two moles of an ideal gas are heated at constant pressure from T=27T = 27°C to T=107T = 107°C. Draw a pVpV-diagram for this process.

Guida verificata passo dopo passo
1
Step 1: Understand the process described. The problem involves heating an ideal gas at constant pressure, which means the process is isobaric. In an isobaric process, the pressure remains constant while the volume changes as the temperature changes.
Step 2: Convert the given temperatures from Celsius to Kelvin, as thermodynamic calculations typically use the Kelvin scale. Use the formula: T(K) = T(°C) + 273.15. So, convert 27°C and 107°C to Kelvin.
Step 3: Use the ideal gas law to understand the relationship between pressure, volume, and temperature. The ideal gas law is given by: pV=nRT, where p is pressure, V is volume, n is the number of moles, R is the ideal gas constant, and T is temperature in Kelvin.
Step 4: Since the process is isobaric, the pressure p is constant. Therefore, the relationship between volume and temperature can be expressed as: VT=V'T', where V and T are the initial volume and temperature, and V' and T' are the final volume and temperature.
Step 5: To draw the pV-diagram, plot the initial and final states on a graph with pressure (p) on the y-axis and volume (V) on the x-axis. Since the pressure is constant, the line connecting the initial and final states will be horizontal, indicating an increase in volume as the temperature increases.

Risposta video verificata per un problema simile:

Questa soluzione video è stata consigliata dai nostri tutor come utile per risolvere questo problema.
Durata del video:
2m

Concetti chiave

Ecco i concetti essenziali che devi comprendere per rispondere correttamente alla domanda.

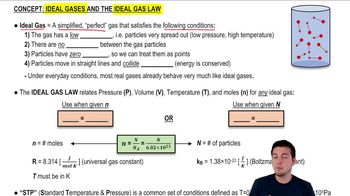
Ideal Gas Law

The Ideal Gas Law is a fundamental equation in thermodynamics, expressed as PV = nRT, where P is pressure, V is volume, n is the number of moles, R is the universal gas constant, and T is temperature in Kelvin. It describes the relationship between these variables for an ideal gas, allowing us to predict how changes in one variable affect the others.
Video consigliato:
Percorso guidato
07:21
Ideal Gases and the Ideal Gas Law

Constant Pressure Process

In a constant pressure process, the pressure of the gas remains unchanged while other variables, such as volume and temperature, may vary. For an ideal gas, as temperature increases at constant pressure, the volume must also increase according to the Ideal Gas Law, resulting in a linear relationship on a pV-diagram.
Video consigliato:
Percorso guidato
08:59
Phase Constant of a Wave Function

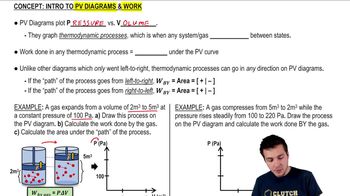
pV-Diagram

A pV-diagram is a graphical representation of the relationship between pressure (p) and volume (V) for a given thermodynamic process. For a constant pressure process, the diagram will show a horizontal line, indicating that pressure remains constant while volume changes. This visualization helps in understanding the behavior of gases during different thermodynamic processes.
Video consigliato:
Percorso guidato
08:07
Work and PV Diagrams