Skip to main content
Precalculus
Il mio corso
Impara
Preparazione agli esami
AI Tutor
Guide di studio
Flashcard
Esplora
Prova l'app
Il mio corso
Impara
Preparazione agli esami
AI Tutor
Guide di studio
Flashcard
Esplora
Prova l'app
Indietro
Area Under a Curve quiz
Puoi toccare per girare la carta.
What geometric shapes can be used to find the area under a linear function?
Puoi toccare per girare la carta.
👆
What geometric shapes can be used to find the area under a linear function?
Rectangles and triangles can be used to find the area under a linear function by matching the graph to these shapes.
Avanzamenti del tracciato
I pulsanti di controllo sono stati cambiati in modalità "navigazione".
1/15
Flashcard correlate
Pratica correlata
Video consigliati
Area Under a Curve definitions
Area Under a Curve
15 Termini
Area Under a Curve
23. Intro to Derivatives & Area Under the Curve
5 Problemi
Argomento
Limits of Sequences
23. Intro to Derivatives & Area Under the Curve
5 Problemi
Argomento
23. Intro to Derivatives & Area Under the Curve
4 Argomenti
12 Problemi
Capitolo
06:52
Approximating Area Under the Curve
257
views
1
rank
06:01
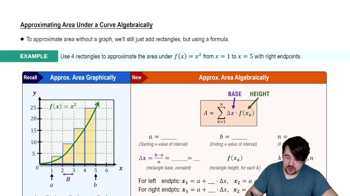
Approximating Area Algebraically
229
views
1
rank
03:50
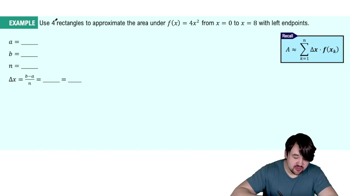
Approximating Area Algebraically Example 1
249
views
1
rank
Termini in questo insieme (15)
Nascondere definizioni
What geometric shapes can be used to find the area under a linear function?
Rectangles and triangles can be used to find the area under a linear function by matching the graph to these shapes.
How do you calculate the area under f(x) = x from x = 0 to x = 5?
You identify the region as a triangle and use the formula 1/2 base times height, which gives an area of 12.5.
What does the area under a curve represent in these problems?
It represents the area between the function's graph and the x-axis over a specified interval.
How do you handle areas under a curve that involve multiple shapes?
You split the region into familiar shapes, calculate each area, and add them together for the total area.
What happens when the function goes below the x-axis in area calculations?
The area calculated is negative, representing the region above the function and below the x-axis.
Why can't familiar shapes be used for curvy graphs like f(x) = x^2?
Curvy graphs do not match the exact shape of triangles or rectangles, so familiar shapes cannot accurately capture the area.
What method is used to approximate the area under a curvy function?
The area is approximated by dividing the region into rectangles and summing their areas.
How do you determine the base of each rectangle when approximating area?
The base is calculated as (b - a) / n, where b and a are the interval endpoints and n is the number of rectangles.
What is the difference between left and right endpoint approximations?
Left endpoint uses the top left corner of each rectangle, while right endpoint uses the top right corner to touch the curve.
Why does a left endpoint approximation often underestimate the area?
It misses some area under the curve, resulting in an under-approximation.
Why does a right endpoint approximation often overestimate the area?
It includes extra area above the curve, resulting in an over-approximation.
How do you calculate the height of each rectangle in an approximation?
The height is found by evaluating the function at the chosen x-value for each rectangle (left or right endpoint).
What is the formula for the x-value of each rectangle for right endpoints?
The x-value is a + k * delta x, where a is the interval start, delta x is the base, and k counts the rectangles starting from 1.
How can you find the exact area under a curve using rectangles?
By taking the limit as the number of rectangles approaches infinity, the approximation becomes exact.
What is the limit definition for the exact area under a curve?
It is the limit as n approaches infinity of the sum of the areas of n rectangles, using the formula: limit n→∞ Σ (delta x * f(x_k)).
 IndietroIndietro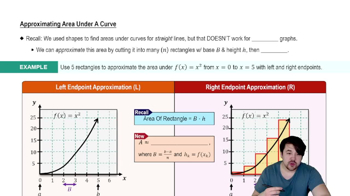
 06:52
06:52