Skip to main content
Precalculus
Il mio corso
Impara
Preparazione agli esami
AI Tutor
Guide di studio
Flashcard
Esplora
Prova l'app
Il mio corso
Impara
Preparazione agli esami
AI Tutor
Guide di studio
Flashcard
Esplora
Prova l'app
Indietro
Graphs of the Sine and Cosine Functions quiz
Puoi toccare per girare la carta.
What coordinate on the unit circle is associated with the sine function?
Puoi toccare per girare la carta.
👆
What coordinate on the unit circle is associated with the sine function?
The sine function is associated with the y-coordinate on the unit circle.
Avanzamenti del tracciato
I pulsanti di controllo sono stati cambiati in modalità "navigazione".
1/15
Flashcard correlate
Pratica correlata
Video consigliati
Graphs of the Sine and Cosine Functions definitions
Graphs of the Sine and Cosine Functions
15 Termini
Graphs of the Sine and Cosine Functions
10. Graphing Trigonometric Functions
6 Problemi
Argomento
Phase Shifts
10. Graphing Trigonometric Functions
3 Problemi
Argomento
10. Graphing Trigonometric Functions
4 Argomenti
7 Problemi
Capitolo
5:05
Amplitude and Reflection of Sine and Cosine
1743
views
53
rank
2:18
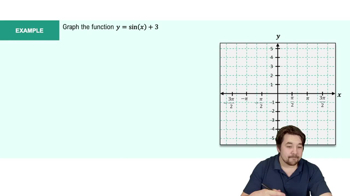
Example 1
1516
views
39
rank
1
comments
5:53
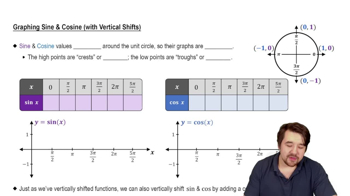
Graph of Sine and Cosine Function
3057
views
97
rank
1
comments
Termini in questo insieme (15)
Nascondere definizioni
What coordinate on the unit circle is associated with the sine function?
The sine function is associated with the y-coordinate on the unit circle.
What coordinate on the unit circle is associated with the cosine function?
The cosine function is associated with the x-coordinate on the unit circle.
What is the general shape of the graphs of sine and cosine functions?
Both sine and cosine graphs have a repeating wave pattern.
Where does the graph of y = sin(x) start on the y-axis?
The graph of y = sin(x) starts at 0 on the y-axis.
Where does the graph of y = cos(x) start on the y-axis?
The graph of y = cos(x) starts at 1 on the y-axis.
What are the high points and low points of a sine or cosine wave called?
High points are called peaks or crests, and low points are called valleys or troughs.
What effect does adding a constant k to y = sin(x) or y = cos(x) have on the graph?
Adding a constant k shifts the graph vertically; positive k shifts up, negative k shifts down.
How would the graph of y = sin(x) + 1 differ from y = sin(x)?
The graph of y = sin(x) + 1 is shifted up by 1 unit compared to y = sin(x).
What is the amplitude of y = sin(x) or y = cos(x)?
The amplitude is 1 for both y = sin(x) and y = cos(x).
How do you change the amplitude of a sine or cosine graph?
Multiply the function by a number; the amplitude becomes the absolute value of that number.
What happens to the graph if the amplitude is negative?
A negative amplitude reflects the graph over the x-axis.
What is the period of y = sin(x) or y = cos(x)?
The period is 2π for both y = sin(x) and y = cos(x).
How does the period change for y = sin(2x)?
The period becomes π, which is half the original period.
What is the formula for the period of y = sin(Bx) or y = cos(Bx)?
The period is calculated as 2π divided by B, where B is the coefficient of x.
If y = cos(4πx), what is the period of the function?
The period is 1/2, calculated as 2π divided by 4π.
 IndietroIndietro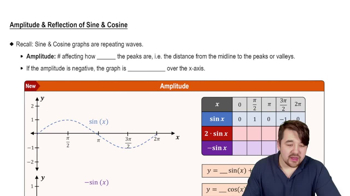
 5:05
5:05