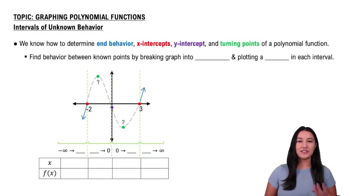
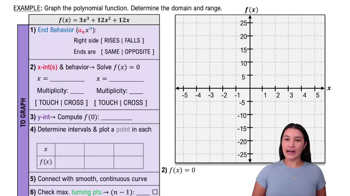
What is the end behavior of a polynomial function of degree 3 with a positive leading coefficient?
The graph behaves like \(x^3\) for large values of x, rising to infinity as x approaches infinity and falling to negative infinity as x approaches negative infinity.
How do you find the y-intercept of a polynomial function?
Evaluate the polynomial at x = 0; the y-intercept is f(0).
How do you find the x-intercepts of a polynomial function?
Solve the equation f(x) = 0 to find the x-values where the graph crosses or touches the x-axis.
What does the multiplicity of a zero tell you about the graph at that zero?
If the zero has odd multiplicity, the graph crosses the x-axis at that zero. If even multiplicity, the graph touches but does not cross the x-axis.
What is the maximum number of turning points for a polynomial function of degree n?
At most n − 1 turning points.
How can additional points help when graphing a polynomial function?
Evaluating the function at points near the zeros helps establish the scale and shape of the graph.
What is the end behavior of a polynomial function of degree 4 with a positive leading coefficient?
The graph behaves like \(x^4\) for large values of x, rising to infinity as x approaches both positive and negative infinity.
How do you use the Zero-Product Property to find x-intercepts?
Factor the polynomial and set each factor equal to zero, then solve for x.
What does a zero of multiplicity 2 indicate about the graph at that zero?
The graph touches the x-axis and turns around at that zero without crossing it.
How do you use a graphing utility to find zeros of a polynomial function?
Use the ZERO, ROOT, or SOLVE feature to approximate x-intercepts.
How do you find turning points using a graphing utility?
Use the MAXIMUM and MINIMUM features to locate local maxima and minima on the graph.
What is the range of a cubic polynomial function with two turning points?
The range is all real numbers, since the graph extends infinitely in both vertical directions.
How can you determine intervals where a polynomial function is increasing or decreasing?
Analyze the graph or use a graphing utility to find intervals where the function rises or falls.
What type of relation might a scatter plot suggest if the data points curve like an S-shape?
A cubic relation may exist between the variables.
How do you find a cubic function of best fit for data using a graphing utility?
Use the CUBIC REGRESSION program to calculate the coefficients of the cubic model.
How do you use a cubic function of best fit to make predictions?
Evaluate the cubic function at the desired x-value to predict the corresponding y-value.
What is the significance of the coefficients a, b, c, and d in a cubic regression equation \(y=ax^3+bx^2+cx+d\)?
They determine the shape and position of the cubic curve that best fits the data.
Why is it helpful to graph the cubic function of best fit on the scatter plot?
It visually shows how well the model fits the data points.
What does it mean if a polynomial function has a zero at x = 2 with multiplicity 1?
The graph crosses the x-axis at x = 2.
What does it mean if a polynomial function has a zero at x = -3 with multiplicity 2?
The graph touches the x-axis at x = -3 but does not cross it.
 Indietro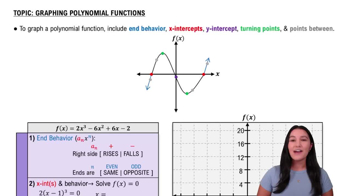
 05:25
05:25