Skip to main content
Precalculus
Il mio corso
Impara
Preparazione agli esami
AI Tutor
Guide di studio
Flashcard
Esplora
Prova l'app
Il mio corso
Impara
Preparazione agli esami
AI Tutor
Guide di studio
Flashcard
Esplora
Prova l'app
Indietro
Graphs and Properties of Sine and Cosine Functions
Puoi toccare per girare la carta.
Domain of sine and cosine functions
Puoi toccare per girare la carta.
👆
Domain of sine and cosine functions
The domain of both sine and cosine functions is the set of all real numbers.
Avanzamenti del tracciato
I pulsanti di controllo sono stati cambiati in modalità "navigazione".
1/20
Video consigliati
5:05
Amplitude and Reflection of Sine and Cosine
1746
views
53
rank
2:18
Example 1
1519
views
39
rank
1
comments
5:53
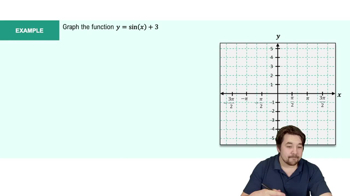
Graph of Sine and Cosine Function
3068
views
97
rank
1
comments
Termini in questo insieme (20)
Nascondere definizioni
Domain of sine and cosine functions
The domain of both sine and cosine functions is the set of all real numbers.
Range of sine and cosine functions
The range of sine and cosine functions is all real numbers from −1 to 1, inclusive.
Period of sine and cosine functions
Both sine and cosine functions have a period of \(2\pi\).
Symmetry of sine function
The sine function is an odd function, symmetric with respect to the origin.
Symmetry of cosine function
The cosine function is an even function, symmetric with respect to the y-axis.
Maximum and minimum values of sine and cosine
Both sine and cosine functions have a maximum value of 1 and a minimum value of −1.
Key x-intercepts of sine function
The sine function has x-intercepts at \(0, \pi, 2\pi\) and multiples thereof.
Key x-intercepts of cosine function
The cosine function has x-intercepts at \(\frac{\pi}{2}, \frac{3\pi}{2}\) and odd multiples thereof.
Effect of amplitude on sine and cosine graphs
Amplitude
A
stretches the graph vertically by a factor of
|A|
, changing the range to [−|A|, |A|].
Effect of frequency (omega) on period
For functions of the form
y = A sin(ωx)
or
y = A cos(ωx)
, the period is \(\frac{2\pi}{\omega}\).
Graphing sine function using key points
Divide one period into four equal subintervals to find five key points for plotting the sine curve.
Graphing cosine function using key points
Divide one period into four equal subintervals to find five key points for plotting the cosine curve.
Vertical shift in sinusoidal functions
Adding a constant
D
to
y = A sin(ωx) + D
or
y = A cos(ωx) + D
shifts the graph vertically by
D
units.
Horizontal compression/stretch in sinusoidal functions
Multiplying the input by
ω
compresses the graph horizontally by a factor of
1/ω
.
Equation form of sinusoidal functions
General form:
y = A sin(ωx + φ) + D
or
y = A cos(ωx + φ) + D
, where
φ
is phase shift.
Amplitude from sinusoidal equation
The amplitude is the absolute value of
A
in the sinusoidal function.
Period from sinusoidal equation
The period is calculated as \(\frac{2\pi}{|\omega|}\).
Finding sinusoidal equation from graph
Identify amplitude, period, phase shift, and vertical shift from the graph to write the equation.
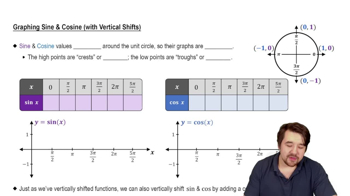
Sine function key points in one period
At \(0, \frac{\pi}{2}, \pi, \frac{3\pi}{2}, 2\pi\), sine values are 0, 1, 0, −1, 0 respectively.
Cosine function key points in one period
At \(0, \frac{\pi}{2}, \pi, \frac{3\pi}{2}, 2\pi\), cosine values are 1, 0, −1, 0, 1 respectively.
 IndietroIndietro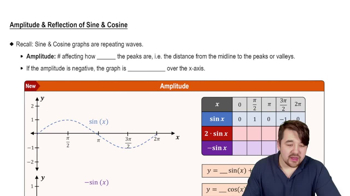
 5:05
5:05