Skip to main content
Introduction to Sociology
Il mio corso
Impara
AI Tutor
Guide di studio
Flashcard
Esplora
Prova l'app
Il mio corso
Impara
AI Tutor
Guide di studio
Flashcard
Esplora
Prova l'app
Indietro
Understanding Research Findings quiz
Puoi toccare per girare la carta.
What are the three measures of central tendency used to summarize typical values in a dataset?
Puoi toccare per girare la carta.
👆
What are the three measures of central tendency used to summarize typical values in a dataset?
The three measures are mean, median, and mode.
Avanzamenti del tracciato
I pulsanti di controllo sono stati cambiati in modalità "navigazione".
1/15
Flashcard correlate
Video consigliati
Understanding Research Findings definitions
Understanding Research Findings
15 Termini
VideoThumbView.guidedCourse
00:56
Understanding Research Findings Example 2
115
views
2
rank
VideoThumbView.guidedCourse
04:31
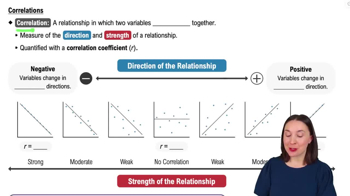
Correlations
143
views
1
rank
VideoThumbView.guidedCourse
03:53
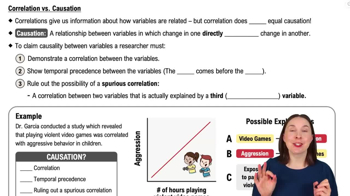
Correlation and Causation
163
views
1
rank
Termini in questo insieme (15)
Nascondere definizioni
What are the three measures of central tendency used to summarize typical values in a dataset?
The three measures are mean, median, and mode.
How is the mean calculated in a dataset?
The mean is calculated by adding up all values and dividing by the number of values.
What does the median represent in a dataset?
The median is the middle value when all numbers are arranged in numerical order.
How do you determine the mode in a dataset?
The mode is the value that occurs most frequently in the dataset.
Why are means sensitive to outliers?
Means are sensitive because outliers can artificially inflate or deflate the average.
Which measure of central tendency is resistant to outliers?
The median is resistant to outliers and is not affected by extreme values.
Can a dataset have more than one mode or no mode at all?
Yes, a dataset can have multiple modes or no mode if all values occur only once.
What is a correlation in sociological research?
A correlation is a relationship in which two variables change together.
What does the correlation coefficient 'r' indicate?
The coefficient 'r' quantifies the direction and strength of the relationship between two variables.
What is the difference between a positive and negative correlation?
Positive correlation means variables change in the same direction; negative means they change in opposite directions.
What does an r value of zero mean?
An r value of zero means there is no correlation between the variables.
How is the strength of a correlation interpreted using the r value?
The closer r is to ±1, the stronger the correlation; values near zero indicate weak or no correlation.
Does correlation imply causation in sociological research?
No, correlation does not imply causation; further evidence is needed to establish causality.
What are the requirements for establishing causality between variables?
Researchers must show correlation, temporal precedence, and rule out spurious correlations.
What is a spurious correlation?
A spurious correlation is a relationship between two variables caused by a third, unaccounted-for variable.
 IndietroIndietro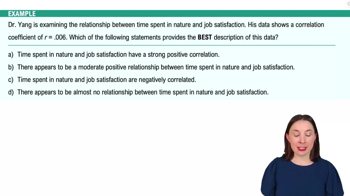
 00:56
00:56