Skip to main content
Introductory Statistics
Il mio corso
Impara
Preparazione agli esami
AI Tutor
Guide di studio
Soluzioni per libri di testo
Flashcard
Esplora
Prova l'app
Il mio corso
Impara
Preparazione agli esami
AI Tutor
Guide di studio
Soluzioni per libri di testo
Flashcard
Esplora
Prova l'app
Indietro
Two Variances - Graphing Calculator quiz
Puoi toccare per girare la carta.
What is the purpose of a two-sample F test for variance?
Puoi toccare per girare la carta.
👆
What is the purpose of a two-sample F test for variance?
It compares sample standard deviations to test hypotheses about population variances.
Avanzamenti del tracciato
I pulsanti di controllo sono stati cambiati in modalità "navigazione".
1/15
Flashcard correlate
Pratica correlata
Video consigliati
Two Variances - Graphing Calculator definitions
Two Variances - Graphing Calculator
15 Termini
Two Variances and F Distribution
10. Hypothesis Testing for Two Samples
5 Problemi
Argomento
Ernest
10. Hypothesis Testing for Two Samples - Part 1 of 2
5 Argomenti
12 Problemi
Capitolo
Brendan
10. Hypothesis Testing for Two Samples - Part 2 of 2
1 Argomento
2 Problemi
Capitolo
Ernest
VideoThumbView.guidedCourse
07:07
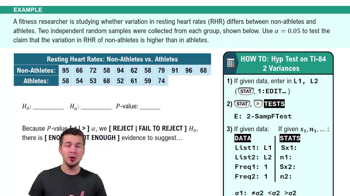
Hypothesis Test for Two Variances Using a TI-84
183
views
VideoThumbView.guidedCourse
05:09
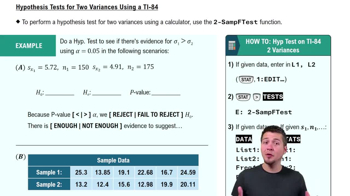
Hypothesis Test for Two Variances Using a TI-84 Example 1
130
views
Termini in questo insieme (15)
Nascondere definizioni
What is the purpose of a two-sample F test for variance?
It compares sample standard deviations to test hypotheses about population variances.
What is the typical null hypothesis in a two-sample F test for variance?
The null hypothesis usually states that σ1 equals σ2.
What does the alternative hypothesis represent in a two-sample F test?
It reflects the claim being tested, such as σ1 > σ2.
What significance level (alpha) was used in the example problems?
Alpha was set at 0.05 in both example scenarios.
What are the two main ways to input data into the graphing calculator for the F test?
You can input either sample statistics or raw data.
Which calculator menu do you use to access the two-sample F test?
You use the stat menu and then go to the tests tab.
What four inputs are required when entering sample statistics for the F test?
You need s1, s2, n1, and n2.
How do you decide which sample is s1 when entering statistics?
s1 should be the sample with the larger standard deviation.
What two values does the calculator provide after running the F test?
It provides the F statistic and the p-value.
What does a p-value less than alpha indicate in the F test?
It means you reject the null hypothesis, indicating significant variance differences.
What is the conclusion if the p-value is greater than alpha?
You fail to reject the null hypothesis, meaning there is not enough evidence for the alternative.
How do you input raw data for the F test on a graphing calculator?
Enter the data into lists L1 and L2, then select the data tab in the F test menu.
What should you check when entering data for the F test?
Ensure sample one and sample two are correctly labeled as L1 and L2.
What type of test should you select if the claim is σ1 > σ2?
You should select a right-tailed test.
What is the main advantage of using the two-sample F test function on a graphing calculator?
It streamlines hypothesis testing for variance, making the process faster and more accurate.
 IndietroIndietro

 07:07
07:07