Skip to main content
Introductory Statistics
Il mio corso
Impara
Preparazione agli esami
AI Tutor
Guide di studio
Soluzioni per libri di testo
Flashcard
Esplora
Prova l'app
Il mio corso
Impara
Preparazione agli esami
AI Tutor
Guide di studio
Soluzioni per libri di testo
Flashcard
Esplora
Prova l'app
Indietro
Two-Way ANOVA - Excel definitions
Puoi toccare per girare la carta.
Two-Way ANOVA
Puoi toccare per girare la carta.
👆
Two-Way ANOVA
Statistical method for comparing means across two factors, allowing assessment of their individual and combined effects.
Avanzamenti del tracciato
I pulsanti di controllo sono stati cambiati in modalità "navigazione".
1/15
Flashcard correlate
Pratica correlata
Video consigliati
Two-Way ANOVA - Excel quiz
Two-Way ANOVA - Excel
15 Termini
Two-Way ANOVA
14. ANOVA
5 Problemi
Argomento
Justin
14. ANOVA - Part 1 of 2
4 Argomenti
12 Problemi
Capitolo
Ally
14. ANOVA - Part 2 of 2
1 Argomento
3 Problemi
Capitolo
Justin
VideoThumbView.guidedCourse
08:34
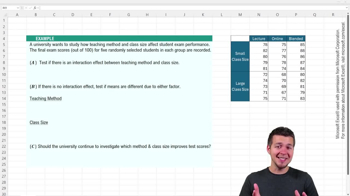
Two-Way ANOVA Using Excel
123
views
2
rank
VideoThumbView.guidedCourse
09:46
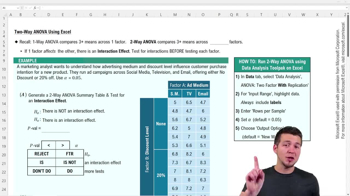
Two-Way ANOVA Using Excel Example 1
151
views
1
rank
Termini in questo insieme (15)
Nascondere definizioni
Two-Way ANOVA
Statistical method for comparing means across two factors, allowing assessment of their individual and combined effects.
Interaction Effect
Phenomenon where the influence of one factor depends on the level of another, complicating interpretation of mean differences.
Factor
Categorical variable whose levels are used to group data for comparison in ANOVA analyses.
Level
Distinct category within a factor, such as types of advertising or discount percentages.
Null Hypothesis
Default assumption stating no interaction or difference in means between groups or factors.
Alternative Hypothesis
Statement suggesting the presence of interaction or differences in means among groups or factors.
P-Value
Probability measure used to determine statistical significance; compared to alpha to guide hypothesis decisions.
Alpha
Threshold for statistical significance, commonly set at 0.05, guiding whether to reject the null hypothesis.
Replication
Design feature in ANOVA where multiple observations are collected for each combination of factor levels.
Source of Variation
Component in ANOVA summary tables identifying where differences in data arise, such as factors or interaction.
F Statistic
Ratio used in ANOVA to compare variance between groups to variance within groups, indicating significance.
Data Analysis Toolpak
Excel add-in providing automated statistical calculations, including ANOVA summary tables.
Summary Table
Output in ANOVA displaying statistics for each factor, interaction, and overall variation.
Advertising Medium
Example factor in business analytics, with levels such as social media, TV, and email.
Discount Level
Example factor representing different price reductions, such as none or 20%.
 IndietroIndietro
 08:34
08:34