 Indietro
Chapter 3: Measures of Center, Variation, and Data Distribution

 04:52
04:52
Termini in questo insieme (20)
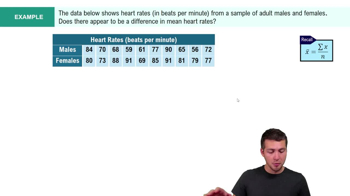
The mean is the arithmetic average, found by summing all data values and dividing by the number of values.
The median is the middle value when data are ordered from least to greatest. It divides the data into two equal halves.
The mode is the value that appears most frequently in the data set.
The midrange is the average of the minimum and maximum values: \(\frac{\text{min} + \text{max}}{2}\).
The median and mode are resistant to outliers, while the mean and midrange are sensitive to extreme values.
The range is the difference between the maximum and minimum values: \(\text{max} - \text{min}\).
Variance is the average of the squared differences from the mean.
Standard deviation is the square root of the variance and measures the average distance of data values from the mean.
Range, variance, and standard deviation are sensitive to outliers because they depend on extreme values.
A data value is significantly high or low if it is far from the mean, often identified using z-scores or being outside typical ranges.
The Empirical Rule states that for a normal distribution, about 68% of data lie within 1 standard deviation, 95% within 2, and 99.7% within 3 standard deviations of the mean.
A z-score measures how many standard deviations a data value is from the mean, indicating its relative position.
A z-score of +2 means the data value is 2 standard deviations above the mean, which is relatively high.
A percentile indicates the percentage of data values below a given value in the ordered data set.
The 25th percentile (first quartile) is the value below which 25% of the data fall.
The 5-number summary includes the minimum, first quartile (Q1), median, third quartile (Q3), and maximum values.
Quartiles divide data into four equal parts; Q1 is the 25th percentile, Q2 (median) is the 50th, and Q3 is the 75th percentile.
The median is preferred because it is resistant to outliers and skewed values, providing a better center measure for skewed data.
A z-score near 0 means the data value is close to the mean.
The 5-number summary provides a quick overview of data spread, center, and potential outliers.