Skip to main content
Introductory Statistics
Il mio corso
Impara
Preparazione agli esami
AI Tutor
Guide di studio
Soluzioni per libri di testo
Flashcard
Esplora
Prova l'app
Il mio corso
Impara
Preparazione agli esami
AI Tutor
Guide di studio
Soluzioni per libri di testo
Flashcard
Esplora
Prova l'app
Indietro
Introductory Statistics: Frequency Distributions
Puoi toccare per girare la carta.
What is a frequency distribution?
Puoi toccare per girare la carta.
👆
What is a frequency distribution?
A
frequency distribution
shows how often each value occurs in a data set.
Avanzamenti del tracciato
I pulsanti di controllo sono stati cambiati in modalità "navigazione".
1/20
Video consigliati
VideoThumbView.guidedCourse
06:19
Intro to Frequency Distributions Example 1
7262
views
311
rank
6
comments
VideoThumbView.guidedCourse
06:29
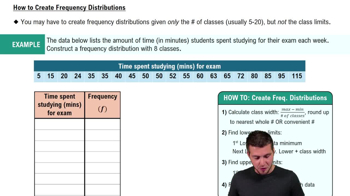
How to Create Frequency Distributions
7006
views
275
rank
1
comments
VideoThumbView.guidedCourse
06:38
Intro to Frequency Distributions
14384
views
574
rank
9
comments
Termini in questo insieme (20)
Nascondere definizioni
What is a frequency distribution?
A
frequency distribution
shows how often each value occurs in a data set.
What is a relative frequency distribution?
A
relative frequency distribution
shows the proportion or percentage of the total number of data points for each value.
What is a cumulative frequency distribution?
A
cumulative frequency distribution
shows the running total of frequencies up to each class or value.
How can you find the frequency of a value in Excel?
Use the
COUNTIF
function to count how many times a value appears in a range.
What is the purpose of bins in a frequency distribution?
Bins
group data values into intervals to organize and summarize data frequencies.
How do you calculate relative frequency from frequency?
Divide the frequency of a class by the
total number of data points
.
How do you calculate cumulative frequency?
Add the frequency of the current class to the cumulative frequency of the previous class.
What Excel tool can be used to create a histogram?
The
Data Analysis Add-in
in Excel can be used to create histograms.
What is an ogive?
An
ogive
is a graph that represents the cumulative frequency distribution.
What type of data is used in the iPhone sales example?
The data is
quantitative discrete
, representing the number of iPhones sold per day.
Why use cell references or formulas in Excel for frequency distributions?
Using
cell references or formulas
ensures dynamic calculations and full credit in assignments.
What does the shape of a histogram tell us?
The
shape
indicates the distribution pattern, such as skewness or symmetry, of the data.
What does a cumulative percentage in a histogram represent?
It shows the percentage of data points that fall below or at a certain bin value.
How do you interpret a relative frequency of 0.1 for selling 3 iPhones?
It means
10%
of the days had sales of exactly 3 iPhones.
What is the total frequency in a frequency distribution?
The
total frequency
is the sum of all individual frequencies, equal to the total number of data points.
Why might you remove gaps between histogram columns?
Removing gaps emphasizes that the data is
continuous or grouped
rather than categorical.
What is the COUNTIF function syntax for counting values equal to 5?
Use \(=COUNTIF(range,5)\) to count cells equal to 5.
How do you construct a relative frequency distribution in Excel?
Divide each frequency by the total frequency using formulas referencing the total cell.
How do you construct a cumulative frequency distribution in Excel?
Use a formula that adds the current frequency to the cumulative frequency of the previous row.
What is the difference between frequency and relative frequency?
Frequency
is the count of occurrences;
relative frequency
is the proportion of total occurrences.
 IndietroIndietro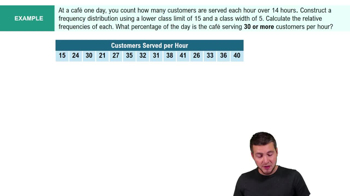
 06:19
06:19