 Indietro
Introductory Statistics Key Concepts
 06:52
06:52
Termini in questo insieme (41)
Population is the entire group; Sample is a subset of the population.
Parameter describes a population; Statistic describes a sample.
Discrete data are counted (e.g., number of siblings); Continuous data are measured (e.g., height).
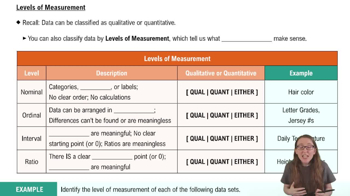
Levels of Measurement (N.O.I.R.)
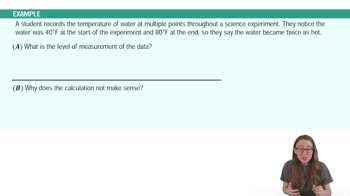
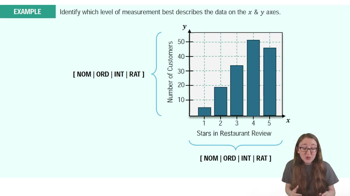
Nominal: categories without order; Ordinal: ordered categories; Interval: ordered with equal intervals, no true zero; Ratio: ordered with equal intervals and true zero.
Each member of the population has an equal chance of being selected.
Sampling individuals who are easiest to reach.
Participants choose whether to participate, often leading to bias.
Select every kth individual from a list or sequence.
Randomly select entire groups or clusters from the population.
Divide population into groups and randomly sample from each group.
A sample that does not fairly represent the population, often due to poor sampling methods.
A variable not included in the study that may affect the results.
Experiment: applies treatment; Observation: no treatment applied.
Types of Studies (3)
Cross-sectional: data at one time; Retrospective: looks back at past data; Prospective: follows subjects into the future.
Difference between lower limit of next class and current class.
Calculated as (Lower class limit + Upper class limit) / 2.
Class Boundaries (example)
For class 20–29, boundaries are 19.5–29.5 to avoid gaps between classes.
Frequency divided by total frequency.
Sum of frequencies up to a certain class as you move down the table.
Sum of all data values divided by the number of values.
Middle value when data are ordered from least to greatest.
Value that occurs most frequently in the data set.
Difference between maximum and minimum values.
z = 0: at mean; z > 0: above mean; z < 0: below mean.
The kth percentile means approximately k% of data are at or below that value.
Q1: 25th percentile; Q2: 50th percentile (median); Q3: 75th percentile.
Difference between Q3 and Q1; represents the middle 50% of data.
Lower fence = Q1 − 1.5(IQR); Upper fence = Q3 + 1.5(IQR).
Stem: leading digit(s); Leaf: final digit of data values.
Minimum, Q1, Median, Q3, Maximum values displayed graphically.
Each dot represents one observation; multiple dots stacked for repeated values.
Sample mean is denoted by \(\bar{x}\).
Population mean is denoted by \(\mu\).
\(\bar{x} = \frac{\sum x}{n}\) where n is sample size.
\(\text{Range} = \text{Max} - \text{Min}\)
\(\bar{x}_w = \frac{\sum wx}{\sum w}\) where w are weights.
\(z = \frac{x - \mu}{\sigma}\) measures how many standard deviations x is from the mean.
\(\text{IQR} = Q_3 - Q_1\)
\(\hat{y} = a + bx\) where a is y-intercept and b is slope.
\(s = \sqrt{\frac{\sum (x - \bar{x})^2}{n-1}}\)
\(\sigma = \sqrt{\frac{\sum (x - \mu)^2}{N}}\)