 Indietro
Introductory Statistics: Key Concepts and Problems
 06:19
06:19

Termini in questo insieme (20)
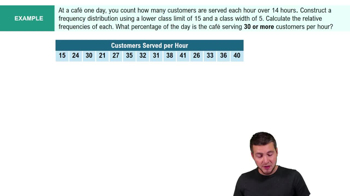
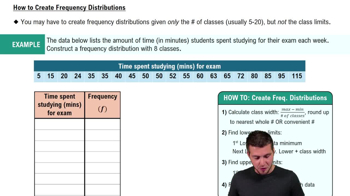
A frequency distribution is a table that shows the number of times each value or range of values occurs in a data set.
List all distinct values or class intervals and count how many data points fall into each category.
Relative frequency is the proportion of the total number of data points that fall into a particular category, calculated as frequency divided by total observations.
Cumulative frequency is the sum of the frequencies for all values up to and including a given value or class interval.
A population includes all members of a group, while a sample is a subset selected from the population for study.
The sample mean is calculated as \(\bar{x} = \frac{\sum x_i}{n}\), where x_i are sample values and n is sample size.
Sample variance is \(s^2 = \frac{\sum (x_i - \bar{x})^2}{n-1}\), measuring data spread around the sample mean.
The sample standard deviation is the square root of the sample variance: \(s = \sqrt{s^2}\).
A histogram displays data distribution by grouping data into bins and showing frequencies as bar heights.
A right-skewed distribution has a longer tail on the right side, indicating more high-value outliers.
The median is the middle value when data are ordered from smallest to largest.
The mode is the value that appears most frequently in the data set.
The class midpoint is the average of the lower and upper boundaries of a class interval.
Multiply each class midpoint by its frequency, sum these products, then divide by total frequency.
It shows the proportion of data values less than or equal to a certain value, useful for percentile calculations.
A histogram is symmetric if the left and right sides are approximately mirror images.
Interval data have meaningful differences but no true zero; ratio data have a true zero allowing ratio comparisons.
A class boundary is the value that separates one class interval from the next without gaps.
Sum all the frequencies listed in the frequency distribution table.
Approximately 68%, 95%, and 99.7% of data fall within 1, 2, and 3 standard deviations from the mean, respectively.