 Indietro
Introductory Statistics: Measures of Center, Variation, and Relative Standing

 04:52
04:52
Termini in questo insieme (25)
A measure of center is a value that represents the middle or center of a data set in some way.
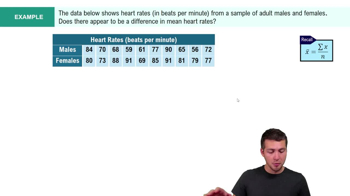
The mean is the sum of all data values divided by the number of values. Sample mean is \(\bar{x}\), population mean is \(\mu\).
The median is the middle value of ordered data. If even number of values, it is the mean of the two middle values.
The mode is the most frequently occurring data value. It can be used for both quantitative and categorical data.
The midrange is the mean of the maximum and minimum values: (max + min) / 2.
A weighted mean accounts for different weights assigned to data values, calculated as sum of (weight × value) divided by sum of weights.
The median is resistant to outliers; the mean and midrange are not resistant.
A measure of variation quantifies the spread or dispersion of data values.
The range is the difference between the maximum and minimum data values.
Standard deviation measures how far data values typically vary from the mean.
Variance is the square of the standard deviation, representing average squared deviation from the mean.
Estimate standard deviation as approximately one-fourth of the range: s ≈ (max − min) / 4.
Values are significantly high if > mean + 2 standard deviations, and significantly low if < mean − 2 standard deviations.
For bell-shaped data: ~68% within 1 SD, ~95% within 2 SDs, ~99.7% within 3 SDs of the mean.
A z-score indicates how many standard deviations a data value is from the mean; positive means above, negative means below.
Sample z-score: \(z=\frac{x-\bar{x}}{s}\), where \(x\) is the data value.
Percentiles divide ordered data into 100 groups; the kth percentile is the value below which approximately k% of data fall.
Arrange data, compute locator L = kn/100; if L integer, average Lth and (L+1)th values; if not, round up and take Lth value.
Quartiles divide data into 4 parts: Q1 (25th percentile), Q2 (median), Q3 (75th percentile). The 5-number summary includes min, Q1, median, Q3, max.
A boxplot visualizes the 5-number summary with a box from Q1 to Q3, a line at the median, and whiskers to min and max values.
The IQR is the range of the middle 50% of data: IQR = Q3 − Q1.
Outliers are values < Q1 − 1.5·IQR or > Q3 + 1.5·IQR.
Skewness is shown by asymmetry in boxplot whiskers or box width; longer whisker or wider box on one side indicates skew.
Unbiased estimators tend to center around the true parameter value; biased estimators do not.
Unbiased: sample mean \(\bar{x}\), sample variance \(s^2\). Biased: sample median, sample range, sample standard deviation \(s\).