 Indietro
WEEK 3

 05:35
05:35

Termini in questo insieme (20)
A response variable is the particular quantity we ask a question about in a study; it is the variable we are interested in studying.
An explanatory variable is any factor that can influence the response variable.
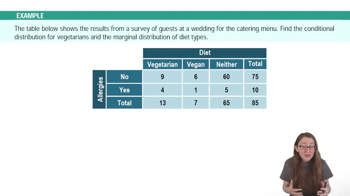
A contingency table displays two categorical variables with rows listing categories of one variable and columns listing categories of the other. Each cell shows the count of observations for that category combination.
Conditional proportions are proportions for categories of the response variable based on the explanatory variable, always summing to 1.0 within each explanatory category.
Marginal proportions are proportions for each category of a variable based on the total sample size.
If the conditional proportions differ considerably between categories of the explanatory variable, there is an association. If proportions are roughly the same, the variables are independent (no association).
A scatterplot is a graphical display for two quantitative variables, with the explanatory variable on the horizontal axis and the response variable on the vertical axis, showing each observation as a point.
A positive association means as the explanatory variable (x) increases, the response variable (y) tends to increase.
A negative association means as the explanatory variable (x) increases, the response variable (y) tends to decrease.
The correlation coefficient r measures the strength and direction of a linear relationship between two quantitative variables, ranging from -1 to +1.
r = +1 means perfect positive linear association, r = -1 means perfect negative linear association, and r = 0 means no linear association.
No, the value of r does not depend on the units of the variables.
The regression line equation is \(\hat{y} = a + bx\), where a is the y-intercept and b is the slope.
The slope b represents the amount the predicted response variable changes when the explanatory variable increases by one unit.
The y-intercept a is the predicted value of y when x = 0.
A residual is the difference between the actual value and the predicted value from the regression line: Residual = actual y - predicted y.
A positive residual means the actual value is larger than predicted; a negative residual means the actual value is smaller than predicted.
r-squared (r²) is the proportion of variation in y explained by the linear relationship with x; values closer to 1 indicate a better fit.
Extrapolation is using a regression line to predict y for x values outside the observed data range, which is risky because the trend may not continue.
Influential observations are data points that have a large effect on the regression line, often outliers with extreme x values.