Ch. 1 - Introduction to Statistics
Larson - Elementary Statistics: Picturing the World 8th Edition
Larson8th EditionElementary Statistics: Picturing the WorldISBN: 9780137493470Non è quello che usi tu?Cambia libro di testo
Capitolo 1, Problema 1.1.13

"Determine whether the data set is a population or a sample. Explain your reasoning.
A survey of 250 members from an organized union of over 20,000 members"

Guida verificata passo dopo passo
1
Step 1: Understand the definitions of population and sample. A population refers to the entire group of individuals or items that you want to study, while a sample is a subset of the population selected for analysis.
Step 2: Identify the total size of the group being studied. In this case, the organized union consists of over 20,000 members, which represents the population.
Step 3: Examine the size of the group surveyed. The problem states that only 250 members were surveyed, which is a subset of the total population.
Step 4: Compare the surveyed group to the population. Since the surveyed group (250 members) is smaller than the total population (20,000 members), it is considered a sample.
Step 5: Conclude that the data set is a sample because it represents only a portion of the entire population, and explain that samples are often used to make inferences about the population when studying the entire population is impractical.

Risposta video verificata per un problema simile:

Questa soluzione video è stata consigliata dai nostri tutor come utile per risolvere questo problema.
Durata del video:
3m

Concetti chiave

Ecco i concetti essenziali che devi comprendere per rispondere correttamente alla domanda.

Population

In statistics, a population refers to the entire group of individuals or items that we are interested in studying. It encompasses all members of a defined group, such as all employees in a company or all voters in an election. Understanding whether a data set represents a population is crucial for determining the scope and applicability of statistical analyses.
Video consigliato:
Percorso guidato
04:48
Population Standard Deviation Known

Sample

A sample is a subset of a population that is selected for analysis. It is used to make inferences about the larger population without needing to collect data from every member. The quality of a sample can significantly affect the validity of conclusions drawn, making it essential to ensure that the sample is representative of the population.
Video consigliato:
Percorso guidato
05:11
Sampling Distribution of Sample Proportion

Sampling Method

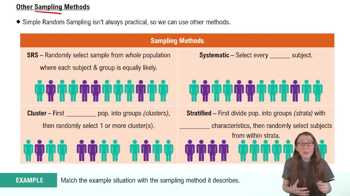
The sampling method refers to the technique used to select individuals from a population to form a sample. Common methods include random sampling, stratified sampling, and convenience sampling. The choice of sampling method impacts the reliability of the results and the extent to which they can be generalized to the population.
Video consigliato:
Percorso guidato
05:27
Sampling Methods
Pratica correlata
Domanda del libro di testo

"Determine whether the data are qualitative or quantitative. Explain your reasoning.

Distances of track events"

117
views

Domanda del libro di testo

In Exercises 9 and 10, determine whether the study is an observational study or an experiment. Explain.


To study the effect of using digital devices in the classroom on exam performance, researchers divided 726 undergraduate students into three groups, including a group that was allowed to use digital devices, a group that had restricted access to tablets, and a control group that was “technologyfree.” (Source: Massachusetts Institute of Technology)

153
views
Domanda del libro di testo

"Determine whether the statement is true or false. If it is false, rewrite it as a true statement.

It is impossible to obtain all the census data about the U.S. population."

96
views
Domanda del libro di testo

Determine whether the statement is true or false. If it is false, rewrite it as a true statement.

More types of calculations can be performed with data at the nominal level than with data at the interval level.

179
views
Domanda del libro di testo

In Exercises 11 and 12, determine whether the data are qualitative or quantitative, and determine the level of measurement of the data set.


The six top-earning states in 2019 by median household income are listed. (Source: U.S. Census Bureau)

1. Maryland 2. New Jersey 3. Hawaii

4. Massachusetts 5. Connecticut 6. Alaska

164
views
Domanda del libro di testo

In Exercises 4 and 5, determine whether the number is a parameter or a statistic. Explain your reasoning.


In 2021, the median annual salary of a first-year chemist was \$58,700.

162
views