

Ch. 10 - Chi-Square Tests and the F-Distribution
Larson - Elementary Statistics: Picturing the World 8th Edition
Larson8th EditionElementary Statistics: Picturing the WorldISBN: 9780137493470Non è quello che usi tu?Cambia libro di testo
Capitolo 10, Problema 10.R.14

"In Exercises 13–16, find the critical F-value for a two-tailed test using the level of significance α and degrees of freedom d.f.N and d.f.D.


α=0.05,d.f.N=9,d.f.D=8"

Guida verificata passo dopo passo
1
Identify the parameters for the F-distribution: the level of significance (α = 0.05), the degrees of freedom for the numerator (d.f.N = 9), and the degrees of freedom for the denominator (d.f.D = 8).
Since this is a two-tailed test, divide the level of significance (α) by 2 to account for both tails of the distribution. This gives α/2 = 0.025 for each tail.
Use an F-distribution table or statistical software to find the critical F-value for the upper tail. Look up the value corresponding to α/2 = 0.025, d.f.N = 9, and d.f.D = 8.
For the lower tail, recall that the F-distribution is not symmetric. The critical value for the lower tail is the reciprocal of the upper-tail critical value. This is because F(1-α/2, d.f.N, d.f.D) = 1 / F(α/2, d.f.D, d.f.N).
Combine the critical values for the upper and lower tails to define the rejection region for the two-tailed test. The rejection region is where the F-statistic is either greater than the upper critical value or less than the lower critical value.

Risposta video verificata per un problema simile:

Questa soluzione video è stata consigliata dai nostri tutor come utile per risolvere questo problema.
Durata del video:
2m

Concetti chiave

Ecco i concetti essenziali che devi comprendere per rispondere correttamente alla domanda.

Critical F-value

The critical F-value is a threshold used in hypothesis testing to determine whether to reject the null hypothesis. It is derived from the F-distribution, which is used when comparing variances between two groups. The critical value is based on the chosen significance level (α) and the degrees of freedom for the numerator (d.f.N) and denominator (d.f.D). If the calculated F-statistic exceeds this critical value, the null hypothesis is rejected.
Video consigliato:
Percorso guidato
05:50
Critical Values: t-Distribution

Degrees of Freedom

Degrees of freedom (d.f.) refer to the number of independent values or quantities that can vary in an analysis without violating any constraints. In the context of an F-test, d.f.N represents the degrees of freedom associated with the numerator (typically the group with more variance), while d.f.D represents the degrees of freedom for the denominator (the group with less variance). These values are crucial for determining the shape of the F-distribution and finding the critical F-value.
Video consigliato:
Percorso guidato
05:50
Critical Values: t-Distribution

Two-tailed Test

A two-tailed test is a statistical test that evaluates whether a sample mean is significantly different from a population mean in either direction (higher or lower). This type of test is used when the alternative hypothesis does not specify a direction of the effect. In the context of the given question, using a two-tailed test with a significance level of α=0.05 means that the critical region for rejecting the null hypothesis is split between both tails of the distribution, requiring consideration of both extremes.
Video consigliato:
Percorso guidato
09:27
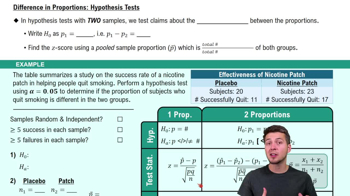
Difference in Proportions: Hypothesis Tests
Pratica correlata
Domanda del libro di testo

In Exercises 21 and 22, (d) decide whether to reject or fail to reject the null hypothesis,

Assume the samples are random and independent, the populations are normally distributed, and the population variances are equal.

[APPLET] The table shows the monthly electric bills (in dollars) for a sample of households from four regions of the United States. At α=0.10, can you conclude that the mean monthly electric bill is different in at least one of the regions? (Adapted from U.S. Energy Information Administration)

20
views
Domanda del libro di testo

In each exercise,

d. decide whether to reject or fail to reject the null hypothesis, and

[APPLET] In Exercises 3 and 4, use the data, which list the annual wages (in thousands of dollars) for randomly selected individuals from three metropolitan areas. Assume the wages are normally distributed and that the samples are independent. (Adapted from U.S. Bureau of Economic Analysis)

Ithaca, NY: 53.0, 60.3, 34.6, 37.1, 46.6, 46.8, 41.4, 50.6, 50.8, 49.4, 35.0, 36.7, 57.1

Little Rock, AR: 50.7, 43.7, 53.4, 40.0, 45.2, 52.7, 35.2, 60.4, 40.0, 45.9, 45.7, 47.3, 46.5, 44.5, 31.5

Madison, WI: 62.4, 53.9, 67.6, 52.9, 67.7, 50.7, 62.1, 58.9, 61.1, 65.0, 60.4, 59.6, 51.3, 44.8, 66.2

Are the mean annual wages the same for all three cities? Use α=0.10. Assume that the population variances are equal.

43
views
Domanda del libro di testo

In Exercises 21 and 22, (a) identify the claim and state H₀ and Hₐ, (b) find the critical value and identify the rejection region, (c) find the test statistic F, (d) decide whether to reject or fail to reject the null hypothesis, and (e) interpret the decision in the context of the original claim. Assume the samples are random and independent, the populations are normally distributed, and the population variances are equal.


[APPLET] The table shows the annual incomes (in dollars) for a sample of families from four regions of the United States. At α=0.05, can you conclude that the mean annual income of families is different in at least one of the regions? (Adapted from U.S. Census Bureau)


53
views
Domanda del libro di testo

"In Exercises 13–16, find the critical F-value for a two-tailed test using the level of significance α and degrees of freedom d.f.N and d.f.D.


α=0.10,d.f.N=15,d.f.D=27"

86
views
Domanda del libro di testo

In each exercise,

a. identify the claim and state H₀ and Hₐ,


In Exercises 1 and 2, use the table, which lists the distribution of educational achievement for people in the United States ages 25 and older. It also lists the results of a random survey for two additional age groups. (Adapted from U.S. Census Bureau)


Use the data for 30- to 34-year-olds and 65- to 69-year-olds to test whether age and educational attainment are related. Use α=0.01.

43
views
Domanda del libro di testo

"In Exercises 9–12, find the critical F-value for a right-tailed test using the level of significance α and degrees of freedom d.f.N and d.f.D.


α=0.05,d.f.N=6,d.f.D=50"

49
views