
Ch. 10 - Chi-Square Tests and the F-Distribution
Larson - Elementary Statistics: Picturing the World 8th Edition
Larson8th EditionElementary Statistics: Picturing the WorldISBN: 9780137493470Non è quello che usi tu?Cambia libro di testo
Capitolo 10, Problema 11.1.6

List the two conditions that must be met in order to use the paired-sample sign test.

Guida verificata passo dopo passo
1
The first condition for using the paired-sample sign test is that the data must consist of paired observations. This means that each observation in one sample is uniquely matched to an observation in the other sample, often representing measurements taken on the same subject under two different conditions or at two different times.
The second condition is that the paired observations must be ordinal or at least capable of being ranked. The sign test does not require interval or ratio-level data, but it does require that the differences between paired observations can be classified as positive, negative, or zero.

Risposta video verificata per un problema simile:

Questa soluzione video è stata consigliata dai nostri tutor come utile per risolvere questo problema.
Durata del video:
3m

Concetti chiave

Ecco i concetti essenziali che devi comprendere per rispondere correttamente alla domanda.

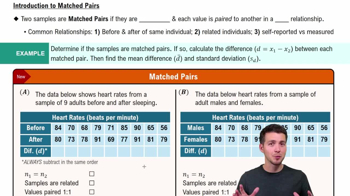
Paired Samples

Paired samples refer to two sets of related observations, where each observation in one sample is uniquely matched with an observation in the other sample. This relationship is crucial for the paired-sample sign test, as it assesses the differences between these matched pairs rather than treating the samples as independent. Examples include measurements taken before and after a treatment on the same subjects.
Video consigliato:
Percorso guidato
08:33
Introduction to Matched Pairs

Non-Normality of Differences

The paired-sample sign test is a non-parametric method used when the differences between paired observations do not follow a normal distribution. This condition is essential because the test relies on the ranks of the differences rather than their actual values, making it suitable for data that may be skewed or ordinal in nature. It allows for valid statistical inference without the assumption of normality.
Video consigliato:
Percorso guidato
03:17
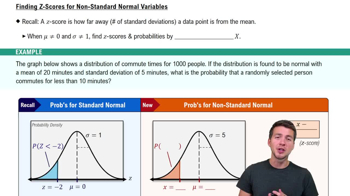
Finding Z-Scores for Non-Standard Normal Variables

Symmetry of Differences

For the paired-sample sign test to be valid, the distribution of the differences between paired observations should be symmetric around the median. This condition ensures that the test accurately reflects the central tendency of the differences, allowing for reliable conclusions about the population from which the samples are drawn. If the differences are highly skewed, alternative methods may be more appropriate.
Video consigliato:
Percorso guidato
08:21
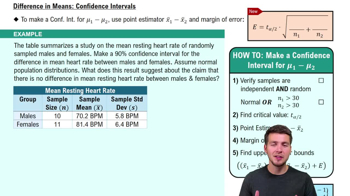
Difference in Means: Confidence Intervals
Pratica correlata
Domanda del libro di testo

Performing a Chi-Square Goodness-of-Fit Test

In Exercises 7–16, (b) find the critical value and identify the rejection region.


Ways to Pay A financial analyst claims that the distribution of people’s preferences on how to pay for goods is different from the distribution shown in the figure. You randomly select 600 people and record their preferences on how to pay for goods. The table shows the results. At α=0.01, test the financial analyst’s claim. (Adapted from Travis Credit Union)


49
views
Domanda del libro di testo

Performing a Chi-Square Goodness-of-Fit Test

In Exercises 7–16, (c) find the chi-square test statistic.


Ways to Pay A financial analyst claims that the distribution of people’s preferences on how to pay for goods is different from the distribution shown in the figure. You randomly select 600 people and record their preferences on how to pay for goods. The table shows the results. At α=0.01, test the financial analyst’s claim. (Adapted from Travis Credit Union)


67
views
Domanda del libro di testo

Performing a Chi-Square Goodness-of-Fit Test

In Exercises 7–16, (d) decide whether to reject or fail to reject the null hypothesis.


Ways to Pay A financial analyst claims that the distribution of people’s preferences on how to pay for goods is different from the distribution shown in the figure. You randomly select 600 people and record their preferences on how to pay for goods. The table shows the results. At α=0.01, test the financial analyst’s claim. (Adapted from Travis Credit Union)


79
views