


Ch. 10 - Chi-Square Tests and the F-Distribution
Larson - Elementary Statistics: Picturing the World 8th Edition
Larson8th EditionElementary Statistics: Picturing the WorldISBN: 9780137493470Non è quello che usi tu?Cambia libro di testo
Capitolo 10, Problema 10.2.24

Performing a Chi-Square Independence Test In Exercises 13–28, perform the indicated chi-square independence test by performing the steps below.
a. Identify the claim and state H₀ and Hₐ


b. Determine the degrees of freedom, find the critical value, and identify the rejection region.


c. Find the chi-square test statistic.


d. Decide whether to reject or fail to reject the null hypothesis.


e. Interpret the decision in the context of the original claim.


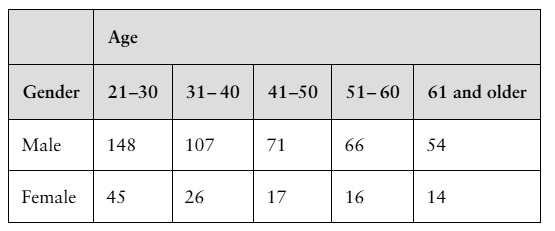
Alcohol-Related Accidents The contingency table shows the results of a random sample of fatally injured passenger vehicle drivers (with blood alcohol concentrations greater than or equal to 0.08) by age and gender. At α=0.05, can you conclude that age is related to gender in such alcohol-related accidents? (Adapted from Insurance Institute for Highway Safety)

Guida verificata passo dopo passo
1
Step 1: Identify the claim and state the null hypothesis (H₀) and alternative hypothesis (Hₐ). The claim is that age is related to gender in alcohol-related accidents. The null hypothesis (H₀) states that age and gender are independent, while the alternative hypothesis (Hₐ) states that age and gender are not independent.
Step 2: Determine the degrees of freedom (df), find the critical value, and identify the rejection region. Degrees of freedom are calculated using the formula: df = (number of rows - 1) × (number of columns - 1). For this table, there are 2 rows (Male, Female) and 5 columns (age groups), so df = (2 - 1) × (5 - 1) = 4. Using α = 0.05, find the critical value from the chi-square distribution table for df = 4. The rejection region is where the test statistic exceeds the critical value.
Step 3: Calculate the expected frequencies for each cell in the contingency table using the formula: Expected frequency = (row total × column total) / grand total. For example, for the cell corresponding to Male and age 21–30, calculate: Expected frequency = (row total for Male × column total for age 21–30) / grand total. Repeat this for all cells in the table.
Step 4: Compute the chi-square test statistic using the formula: χ² = Σ((Observed frequency - Expected frequency)² / Expected frequency). For each cell, subtract the expected frequency from the observed frequency, square the result, divide by the expected frequency, and sum these values across all cells.
Step 5: Compare the calculated chi-square test statistic to the critical value. If the test statistic exceeds the critical value, reject the null hypothesis (H₀). Otherwise, fail to reject the null hypothesis. Interpret the decision in the context of the original claim: If H₀ is rejected, conclude that age is related to gender in alcohol-related accidents; if H₀ is not rejected, conclude that there is insufficient evidence to support the claim.

Risposta video verificata per un problema simile:

Questa soluzione video è stata consigliata dai nostri tutor come utile per risolvere questo problema.
Durata del video:
5m

Concetti chiave

Ecco i concetti essenziali che devi comprendere per rispondere correttamente alla domanda.

Chi-Square Independence Test

The Chi-Square Independence Test is a statistical method used to determine if there is a significant association between two categorical variables. It compares the observed frequencies in each category of a contingency table to the frequencies expected if the variables were independent. A significant result indicates that the variables are related, while a non-significant result suggests independence.
Video consigliato:
Percorso guidato
06:28
Independence Test

Null and Alternative Hypotheses

In hypothesis testing, the null hypothesis (H₀) represents the default position that there is no effect or relationship between the variables being studied. The alternative hypothesis (Hₐ) posits that there is a significant effect or relationship. In the context of the Chi-Square test, H₀ would state that age and gender are independent, while Hₐ would suggest that they are related.
Video consigliato:
Percorso guidato
06:21
Step 1: Write Hypotheses

Degrees of Freedom and Critical Value

Degrees of freedom in a Chi-Square test are calculated based on the number of categories in the variables being analyzed, typically as (rows - 1) * (columns - 1). The critical value is a threshold that determines the rejection region for the null hypothesis. If the calculated Chi-Square statistic exceeds the critical value at a specified significance level (e.g., α=0.05), the null hypothesis is rejected, indicating a significant relationship between the variables.
Video consigliato:
Percorso guidato
05:50
Critical Values: t-Distribution
Pratica correlata
Domanda del libro di testo

"Using Technology to Perform a Two-Way ANOVA Test In Exercises 15–18, use technology and the block design to perform a two-way ANOVA test. Use α=0.10. Interpret the results. Assume the samples are random and independent, the populations are normally distributed, and the population variances are equal.


[APPLET] Laptop Repairs The manager of a computer repair service wants to determine whether there is a difference in the time it takes four technicians to repair different brands of laptops. The block design shows the times (in minutes) it took for each technician to repair three laptops of each brand.

48
views
Domanda del libro di testo

Finding Expected Frequencies

In Exercises 3–6, find the expected frequency for the values of n and pᵢ.


n=415, pᵢ=0.08

126
views
Domanda del libro di testo

"Finding a Critical F-Value for a Two-Tailed Test In Exercises 9–12, find the critical F-value for a two-tailed test using the level of significance α and degrees of freedom d.f.N and d.f.D.


α=0.10, d.f.N=24, d.f.D=28"

88
views
Domanda del libro di testo

State the null and alternative hypotheses for a one-way ANOVA test.

261
views
Domanda del libro di testo

In Exercises 13–18, test the claim about the difference between two population variances σ₁² and σ₂² at the level of significance α. Assume the samples are random and independent, and the populations are normally distributed.


Claim: σ₁² ≠ σ₂²; α = 0.05.

Sample statistics: s₁² = 245, n₁ = 31 and s₂² = 112, n₂ = 28

46
views