


Ch. 2 - Descriptive Statistics
Larson - Elementary Statistics: Picturing the World 8th Edition
Larson8th EditionElementary Statistics: Picturing the WorldISBN: 9780137493470Non è quello che usi tu?Cambia libro di testo
Capitolo 2, Problema 2.4.18

Estimating Standard Deviation Both data sets shown in the stem-and-leaf plots have a mean of 165. One has a standard deviation of 16, and the other has a standard deviation of 24. By looking at the stem-and-leaf plots, which is which? Explain your reasoning.


Stem-and-leaf plot displaying two data sets with a key for interpretation. Stem-and-leaf plot displaying data sets with a mean of 165 and varying standard deviations.

Guida verificata passo dopo passo
1
Step 1: Understand the concept of standard deviation. Standard deviation measures the spread of data points around the mean. A smaller standard deviation indicates that the data points are closer to the mean, while a larger standard deviation indicates that the data points are more spread out.
Step 2: Analyze the first stem-and-leaf plot. Observe the spread of the data points around the mean (165). Note that the values range from 128 to 207, and the data points appear to be more spread out, with larger gaps between values.
Step 3: Analyze the second stem-and-leaf plot. Observe the spread of the data points around the mean (165). Note that the values range from 131 to 192, and the data points appear to be closer to the mean, with smaller gaps between values.
Step 4: Compare the spreads of the two plots. The first plot has a wider range and more variability in the data points, suggesting a larger standard deviation. The second plot has a narrower range and less variability, suggesting a smaller standard deviation.
Step 5: Conclude which plot corresponds to which standard deviation. Based on the analysis, the first plot likely corresponds to the standard deviation of 24, and the second plot likely corresponds to the standard deviation of 16.

Risposta video verificata per un problema simile:

Questa soluzione video è stata consigliata dai nostri tutor come utile per risolvere questo problema.
Durata del video:
3m

Concetti chiave

Ecco i concetti essenziali che devi comprendere per rispondere correttamente alla domanda.

Standard Deviation

Standard deviation is a measure of the amount of variation or dispersion in a set of values. A low standard deviation indicates that the values tend to be close to the mean, while a high standard deviation indicates that the values are spread out over a wider range. In this question, the two data sets have different standard deviations, which affects how tightly the data points cluster around the mean.
Video consigliato:
Percorso guidato
08:45
Calculating Standard Deviation

Stem-and-Leaf Plot

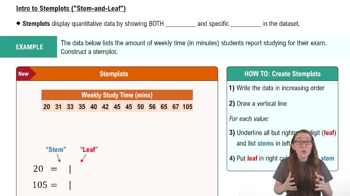
A stem-and-leaf plot is a method of displaying quantitative data in a graphical format, similar to a histogram, to retain the original data values while showing their distribution. Each number is split into a 'stem' (the leading digit or digits) and a 'leaf' (the trailing digit). This visualization helps in comparing distributions and identifying the spread of data, which is crucial for determining the standard deviation.
Video consigliato:
Percorso guidato
06:23
Creating Stemplots

Mean

The mean, or average, is calculated by summing all the values in a data set and dividing by the number of values. In this question, both data sets have the same mean of 165, which indicates that the central tendency is identical. However, the differing standard deviations suggest that the data points are distributed differently around this mean, which can be inferred from the stem-and-leaf plots.
Video consigliato:
Percorso guidato
04:52
Calculating the Mean
Pratica correlata
Domanda del libro di testo

Comparing z-Scores from Different Data Sets The table shows population statistics for the ages of Best Actor and Best Supporting Actor winners at the Academy Awards from 1929 to 2020. The distributions of the ages are approximately bell-shaped. In Exercises 51–54, compare the z-scores for the actors.


Best Actor 1970: John Wayne, Age: 62

Best Supporting Actor 1970: Gig Young, Age: 56

107
views
Domanda del libro di testo

Using and Interpreting Concepts


Finding and Discussing the Mean, Median, and Mode In Exercises 17–34, find the mean, the median, and the mode of the data, if possible. If any measure cannot be found or does not represent the center of the data, explain why.


Cholesterol The cholesterol levels of a sample of 10 female employees

154 240 171 188 235 203 184 173 181 275

129
views
Domanda del libro di testo

True or False? In Exercises 7–10, determine whether the statement is true or false. If it is false, rewrite it as a true statement.


It is impossible to have a z-score of 0.

198
views
Domanda del libro di testo

Using Technology to Find Quartiles and Draw Graphs In Exercises 23–26, use technology to draw a box-and-whisker plot that represents the data set.


Vacation Days The number of vacation days used by a sample of 20 employees in a recent year

3 9 2 1 7 5 3 2 2 6

4 0 10 0 3 5 7 8 6 5

150
views
Domanda del libro di testo

Finding a Percentile In Exercises 33–36, use the data set, which represents the ages of 30 executives.

43 57 65 47 57 41 56 53 61 54

56 50 66 56 50 61 47 40 50 43

54 41 48 45 28 35 38 43 42 44


Which ages are above the 75th percentile?

421
views
Domanda del libro di testo

In Exercises 13 and 14, find the range, mean, variance, and standard deviation of the population data set.


Drunk Driving The number of alcohol-impaired crash fatalities (in thousands) per year from 2010 through 2019 (Source: National Highway Traffic Safety Administration)

10.1 9.9 10.3 10.1 9.9 10.3 11.0 10.9 10.7 10.1

119
views