Ch. 2 - Descriptive Statistics
Larson - Elementary Statistics: Picturing the World 8th Edition
Larson8th EditionElementary Statistics: Picturing the WorldISBN: 9780137493470Non è quello che usi tu?Cambia libro di testo
Capitolo 2, Problema 2.3.65a

Extending Concepts


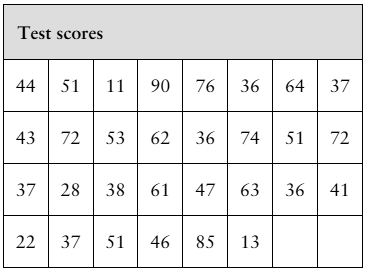
Data Analysis Students in an experimental psychology class did research on depression as a sign of stress. A test was administered to a sample of 30 students. The scores are shown in the table at the left.


<IMAGE>


a. Find the mean and the median of the data.

Guida verificata passo dopo passo
1
Step 1: Organize the data. Write down all the test scores from the table in a single list: [44, 51, 11, 90, 76, 36, 64, 37, 43, 72, 53, 62, 36, 74, 51, 72, 37, 28, 38, 61, 47, 63, 36, 41, 22, 37, 51, 46, 85, 13].
Step 2: Calculate the mean. To find the mean, sum all the test scores and divide by the total number of scores (30). Use the formula: Mean=∑xn, where ∑x is the sum of all scores and n is the number of scores.
Step 3: Sort the data in ascending order to find the median. The sorted list is: [11, 13, 22, 28, 36, 36, 36, 37, 37, 37, 38, 41, 43, 44, 46, 47, 51, 51, 51, 53, 61, 62, 63, 64, 72, 72, 74, 76, 85, 90].
Step 4: Identify the median. Since there are 30 scores (an even number), the median is the average of the 15th and 16th values in the sorted list. Use the formula: Median=x15+x162, where x15 and x16 are the 15th and 16th values in the sorted list.
Step 5: Perform the calculations for both the mean and the median using the formulas provided in steps 2 and 4. Ensure accuracy by double-checking the sum and the sorted list.

Risposta video verificata per un problema simile:

Questa soluzione video è stata consigliata dai nostri tutor come utile per risolvere questo problema.
Durata del video:
1m

Concetti chiave

Ecco i concetti essenziali che devi comprendere per rispondere correttamente alla domanda.

Mean

The mean, or average, is calculated by summing all the values in a dataset and dividing by the number of values. It provides a central value that represents the dataset, but can be influenced by extreme values (outliers). For example, in the given test scores, the mean would give an overall sense of the students' performance.
Video consigliato:
Percorso guidato
04:52
Calculating the Mean

Median

The median is the middle value of a dataset when it is ordered from least to greatest. If there is an even number of observations, the median is the average of the two middle numbers. This measure is less affected by outliers and provides a better representation of the central tendency in skewed distributions, making it useful for analyzing the test scores.
Video consigliato:
Percorso guidato
03:26
Calculating the Median

Data Distribution

Data distribution refers to how values are spread or arranged in a dataset. Understanding the distribution helps in identifying patterns, trends, and the presence of outliers. In the context of the test scores, analyzing the distribution can reveal insights about the overall performance of the students and how their scores relate to each other.
Video consigliato:
Percorso guidato
04:39
Visualizing Qualitative vs. Quantitative Data