Ch. 2 - Descriptive Statistics
Larson - Elementary Statistics: Picturing the World 8th Edition
Larson8th EditionElementary Statistics: Picturing the WorldISBN: 9780137493470Non è quello che usi tu?Cambia libro di testo
Capitolo 2, Problema 2.5.47

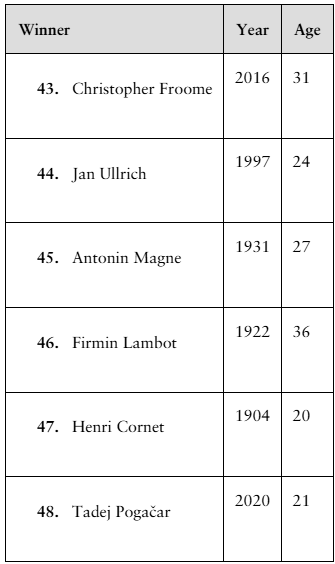
Finding z-Scores The distribution of the ages of the winners of the Tour de France from 1903 to 2020 is approximately bell-shaped. The mean age is 27.9 years, with a standard deviation of 3.4 years. In Exercises 43–48, use the corresponding z-score to determine whether the age is unusual. Explain your reasoning. (Source: Le Tour de France)
tab2

Guida verificata passo dopo passo
1
Step 1: Understand the z-score formula. The z-score is calculated using the formula: z=x-μσ, where x is the observed value, μ is the mean, and σ is the standard deviation.
Step 2: Identify the mean and standard deviation provided in the problem. The mean age (μ) is 27.9 years, and the standard deviation (σ) is 3.4 years.
Step 3: For each winner's age, substitute the values into the z-score formula. For example, for Christopher Froome (age 31), substitute x = 31, μ = 27.9, and σ = 3.4 into the formula.
Step 4: Interpret the z-score. A z-score greater than 2 or less than -2 is considered unusual because it indicates that the value is more than 2 standard deviations away from the mean.
Step 5: Repeat the calculation for each winner's age (24, 27, 36, 20, and 21) and determine whether each age is unusual based on its z-score. Provide reasoning for each case based on the z-score interpretation.

Risposta video verificata per un problema simile:

Questa soluzione video è stata consigliata dai nostri tutor come utile per risolvere questo problema.
Durata del video:
1m

Concetti chiave

Ecco i concetti essenziali che devi comprendere per rispondere correttamente alla domanda.

Z-Score

A z-score measures how many standard deviations an element is from the mean of a distribution. It is calculated by subtracting the mean from the value and then dividing by the standard deviation. Z-scores help identify unusual values in a dataset; typically, a z-score greater than 2 or less than -2 indicates that the value is unusual.
Video consigliato:
Percorso guidato
06:31
Z-Scores From Given Probability - TI-84 (CE) Calculator

Normal Distribution

A normal distribution is a bell-shaped probability distribution characterized by its mean and standard deviation. In a normal distribution, most of the observations cluster around the central peak, and the probabilities for values further away from the mean taper off symmetrically. Understanding this concept is crucial for interpreting z-scores and determining the unusualness of data points.
Video consigliato:
Percorso guidato
06:23
Using the Normal Distribution to Approximate Binomial Probabilities

Standard Deviation

Standard deviation is a statistic that quantifies the amount of variation or dispersion in a set of values. A low standard deviation indicates that the values tend to be close to the mean, while a high standard deviation indicates that the values are spread out over a wider range. In the context of z-scores, the standard deviation is essential for determining how far a particular value is from the mean.
Video consigliato:
Percorso guidato
08:45
Calculating Standard Deviation