Ch. 2 - Descriptive Statistics
Larson - Elementary Statistics: Picturing the World 8th Edition
Larson8th EditionElementary Statistics: Picturing the WorldISBN: 9780137493470Non è quello che usi tu?Cambia libro di testo
Capitolo 2, Problema 2.5.41

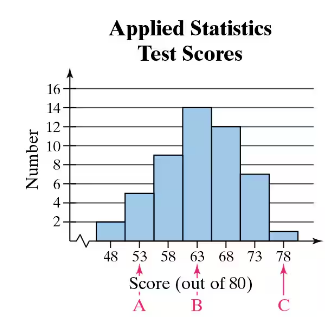
Graphical Analysis In Exercises 41 and 42, the midpoints A, B, and C are marked on the histograms at the left. Match them with the indicated z-scores. Which z-scores, if any, would be considered unusual?


z = 0, z = 2.14, z = −1.43


grapj

Guida verificata passo dopo passo
1
Step 1: Understand the problem. The histogram represents test scores, and the midpoints A, B, and C are marked. We need to match these midpoints with the given z-scores (z = 0, z = 2.14, z = −1.43) and determine which z-scores are unusual. Recall that z-scores measure how many standard deviations a data point is from the mean.
Step 2: Identify the mean and standard deviation. The histogram shows a distribution of scores. The mean is likely near the center of the distribution, which corresponds to the midpoint B (score = 63). The standard deviation can be estimated based on the spread of the data.
Step 3: Match z-scores to midpoints. A z-score of 0 corresponds to the mean, so midpoint B (score = 63) matches z = 0. A z-score of −1.43 indicates a value below the mean, so midpoint A (score = 53) matches z = −1.43. A z-score of 2.14 indicates a value above the mean, so midpoint C (score = 78) matches z = 2.14.
Step 4: Determine unusual z-scores. A z-score is considered unusual if it is less than −2 or greater than 2. In this case, z = 2.14 is greater than 2, so it is considered unusual. The other z-scores (z = 0 and z = −1.43) are not unusual.
Step 5: Summarize the findings. Midpoint B corresponds to z = 0, midpoint A corresponds to z = −1.43, and midpoint C corresponds to z = 2.14. The z-score of 2.14 is considered unusual because it is greater than 2.

Risposta video verificata per un problema simile:

Questa soluzione video è stata consigliata dai nostri tutor come utile per risolvere questo problema.
Durata del video:
2m

Concetti chiave

Ecco i concetti essenziali che devi comprendere per rispondere correttamente alla domanda.

Z-scores

A z-score indicates how many standard deviations an element is from the mean of a dataset. It is calculated by subtracting the mean from the value and then dividing by the standard deviation. Z-scores help in understanding the relative position of a score within a distribution, allowing for comparisons across different datasets.
Video consigliato:
Percorso guidato
06:31
Z-Scores From Given Probability - TI-84 (CE) Calculator

Unusual z-scores

In statistics, z-scores that are greater than 2 or less than -2 are often considered unusual, as they lie outside the typical range of values in a normal distribution. This threshold indicates that the score is significantly different from the mean, suggesting it may represent an outlier or an exceptional case within the data.
Video consigliato:
Percorso guidato
06:31
Z-Scores From Given Probability - TI-84 (CE) Calculator

Histograms

A histogram is a graphical representation of the distribution of numerical data, where the data is divided into bins or intervals. The height of each bar represents the frequency of data points within that interval. Histograms provide a visual summary of the data's distribution, helping to identify patterns, trends, and potential outliers.
Video consigliato:
Percorso guidato
05:54
Intro to Histograms
Pratica correlata
Domanda del libro di testo

Graphical Analysis In Exercises 9–12, determine whether the approximate shape of the distribution in the histogram is symmetric, uniform, skewed left, skewed right, or none of these. Justify your answer.

114
views

Domanda del libro di testo

Putting Graphs in Context In Exercises 5–8, match the plot with the description of the sample.

a. Times (in minutes) it takes a sample of employees to drive to work

b. Grade point averages of a sample of students with finance majors

c. Top speeds (in miles per hour) of a sample of high-performance sports cars

d. Ages (in years) of a sample of residents of a retirement home


" style="" width="220">

81
views
Domanda del libro di testo

Graphical Analysis In Exercises 9–12, determine whether the approximate shape of the distribution in the histogram is symmetric, uniform, skewed left, skewed right, or none of these. Justify your answer.

155
views
Domanda del libro di testo

Using the Empirical Rule In Exercises 29–34, use the Empirical Rule.


The speeds for eight vehicles are listed. Using the sample statistics from Exercise 29, determine which of the data entries are unusual. Are any of the data entries very unusual? Explain your reasoning.

70, 78, 62, 71, 65, 76, 82, 64

185
views
Domanda del libro di testo

Using and Interpreting Concepts


Finding and Discussing the Mean, Median, and Mode In Exercises 17–34, find the mean, the median, and the mode of the data, if possible. If any measure cannot be found or does not represent the center of the data, explain why.


Prices (in dollars) of Flights from Chicago to Alanta

" style="" width="235">

64
views
Domanda del libro di testo

Using and Interpreting Concepts


Graphical Analysis In Exercises 13–16, give three observations that can be made from the graph.


119
views