


Ch. 2 - Descriptive Statistics
Larson - Elementary Statistics: Picturing the World 8th Edition
Larson8th EditionElementary Statistics: Picturing the WorldISBN: 9780137493470Non è quello che usi tu?Cambia libro di testo
Capitolo 2, Problema 2.R.25

In Exercises 25 and 26, find the range, mean, variance, and standard deviation of the population data set.


The mileages (in thousands of miles) for a rental car company’s fleet.
4 2 9 12 15 3 6 8 1 4 14 12 3 3

Guida verificata passo dopo passo
1
Step 1: Calculate the range of the data set. The range is the difference between the maximum and minimum values in the data set. Identify the maximum value (15) and the minimum value (1), then compute the range as: Range = Max - Min.
Step 2: Calculate the mean of the data set. The mean is the sum of all data values divided by the total number of values. Use the formula: Mean = ∑xn, where ∑x is the sum of all data points and n is the number of data points.
Step 3: Calculate the variance of the population data set. The variance measures the average squared deviation from the mean. Use the formula: Variance = ∑(x-Mean)2n, where x represents each data point, Mean is the mean, and n is the number of data points.
Step 4: Calculate the standard deviation of the population data set. The standard deviation is the square root of the variance. Use the formula: Standard Deviation = Variance.
Step 5: Organize your results. After performing the calculations for the range, mean, variance, and standard deviation, summarize them clearly for interpretation.

Risposta video verificata per un problema simile:

Questa soluzione video è stata consigliata dai nostri tutor come utile per risolvere questo problema.
Durata del video:
6m

Concetti chiave

Ecco i concetti essenziali che devi comprendere per rispondere correttamente alla domanda.

Descriptive Statistics

Descriptive statistics summarize and describe the main features of a data set. Key measures include the range, which indicates the difference between the maximum and minimum values, and the mean, which is the average of the data points. Variance and standard deviation measure the spread of the data, indicating how much the values deviate from the mean.
Video consigliato:
Percorso guidato
05:53
Parameters vs. Statistics

Range

The range is a simple measure of variability that calculates the difference between the highest and lowest values in a data set. It provides a quick sense of the spread of the data but does not account for how the values are distributed within that range. For example, in the given mileages, the range would be calculated as the maximum mileage minus the minimum mileage.
Video consigliato:
Percorso guidato
05:45
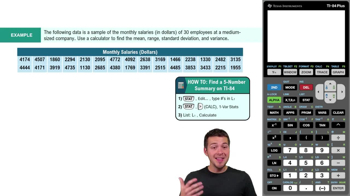
Find 5-Number Summary - TI-84 Calculator Example 1

Variance and Standard Deviation

Variance quantifies the degree of spread in a data set by averaging the squared differences from the mean. Standard deviation, the square root of variance, provides a measure of spread in the same units as the data, making it more interpretable. Both metrics are essential for understanding the distribution and consistency of the data points in the population.
Video consigliato:
Percorso guidato
08:45
Calculating Standard Deviation
Pratica correlata
Domanda del libro di testo

In Exercises 17–19, use the data set, which represents the points recorded by each player on the Winnipeg Jets in the 2019–2020 NHL season. (Source: National Hockey League)

8 8 8 6 0 73 26 1

0 5 58 1 7 5 10 63

0 5 10 0 31 5 15 45

16 29 10 73 5 3 0 65


Construct a frequency distribution for the data set using eight classes. Include class limits, midpoints, boundaries, frequencies, relative frequencies, and cumulative frequencies.

116
views
Domanda del libro di testo

In Exercises 37– 40, use the data set, which represents the model 2020 vehicles with the highest fuel economies (in miles per gallon) in the most popular classes. (Source: U.S. Environmental Protection Agency)

36 30 30 45 31 113 113 33 33 33 52 141 56 117 58

118 50 26 23 23 27 48 22 22 22 121 41 105 35 35


Find the five-number summary of the data set.

89
views
Domanda del libro di testo

The towing capacities (in pounds) of all the pickup trucks at a dealership have a bell-shaped distribution, with a mean of 11,830 pounds and a standard deviation of 2370 pounds. In Exercises 45– 48, use the corresponding z-score to determine whether the towing capacity is unusual. Explain your reasoning.


5,500 pounds

68
views
Domanda del libro di testo

In Exercises 37– 40, use the data set, which represents the model 2020 vehicles with the highest fuel economies (in miles per gallon) in the most popular classes. (Source: U.S. Environmental Protection Agency)

36 30 30 45 31 113 113 33 33 33 52 141 56 117 58

118 50 26 23 23 27 48 22 22 22 121 41 105 35 35


About how many vehicles fall on or below the third quartile?

134
views
Domanda del libro di testo

In Exercises 7 and 8, use the data set shown in the table at the left, which represents the pollution indices (a unitless measure of pollution ranging from 0 to 100) for 24 U.S. cities. (Adapted from Numbeo)

Use a dot plot to display the data set. Describe any patterns.

102
views
Domanda del libro di testo

In Exercises 13 and 14, find the mean, the median, and the mode of the data, if possible. If any measure cannot be found or does not represent the center of the data, explain why.


The responses of 1019 adults who were asked how much money they think they will spend on Christmas gifts in a recent year (Adapted from Gallup)


" style="" width="500">

135
views