Ch. 2 - Descriptive Statistics
Larson - Elementary Statistics: Picturing the World 8th Edition
Larson8th EditionElementary Statistics: Picturing the WorldISBN: 9780137493470Non è quello che usi tu?Cambia libro di testo
Capitolo 2, Problema 2.1.26a

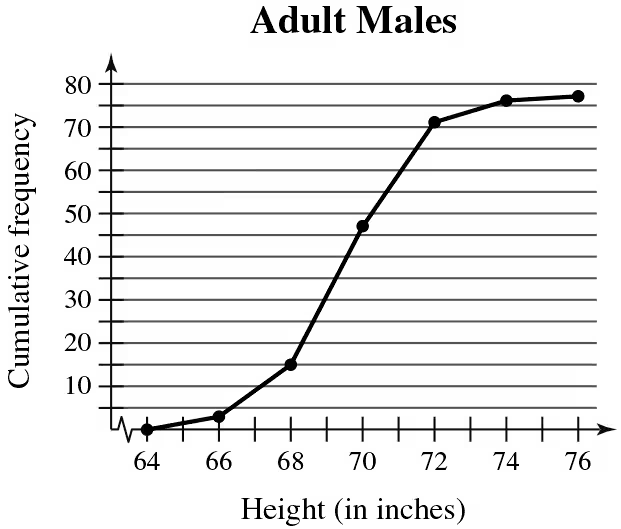
use the ogive to approximate
the number in the sample.
Graph showing cumulative frequency of adult males' heights, ranging from 64 to 76 inches, with data points connected by a line.

Guida verificata passo dopo passo
1
Step 1: Understand the ogive graph. An ogive is a cumulative frequency graph that shows the total number of observations below a certain value. In this case, the graph represents the cumulative frequency of adult males' heights in inches.
Step 2: Identify the highest cumulative frequency on the graph. The highest point on the ogive corresponds to the total number of observations in the sample. In this graph, the cumulative frequency reaches 80 at the height of 76 inches.
Step 3: Approximate the total sample size. Since the cumulative frequency at the highest point represents the total number of individuals in the sample, the total sample size is approximately 80.
Step 4: Verify the interpretation. Ensure that the cumulative frequency values increase consistently and that the graph ends at the total sample size. This confirms the ogive is correctly interpreted.
Step 5: Use the ogive for further analysis. You can use the graph to determine the number of individuals below specific height thresholds or calculate proportions within certain ranges.

Risposta video verificata per un problema simile:

Questa soluzione video è stata consigliata dai nostri tutor come utile per risolvere questo problema.
Durata del video:
1m

Concetti chiave

Ecco i concetti essenziali che devi comprendere per rispondere correttamente alla domanda.

Ogive

An ogive is a graphical representation of cumulative frequency, which shows the number of observations that fall below a particular value in a dataset. It is constructed by plotting cumulative frequencies against the upper boundaries of the class intervals. The resulting curve helps in understanding the distribution of data and can be used to estimate the number of observations within specific ranges.

Cumulative Frequency

Cumulative frequency is the running total of frequencies in a dataset, which indicates how many observations fall below or at a certain value. It is calculated by adding the frequency of each class interval to the sum of the frequencies of all preceding intervals. This concept is essential for constructing ogives and helps in analyzing the distribution of data over a range.
Video consigliato:
Percorso guidato
04:41
Creating Frequency Polygons

Interpreting Graphs

Interpreting graphs involves analyzing visual data representations to extract meaningful information. In the context of an ogive, one must understand how to read the axes, identify key points, and determine cumulative frequencies at specific heights. This skill is crucial for making approximations and drawing conclusions based on the graphical data presented.
Video consigliato:
Percorso guidato
04:13
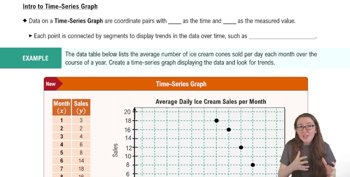
Creating Time-Series Graphs
Pratica correlata
Domanda del libro di testo

Using and Interpreting Concepts


Using and Interpreting Concepts Finding Quartiles, Interquartile Range, and Outliers In Exercises 11 and 12,

(a) find the quartiles


56 63 51 60 57 60 60 54 63 59 80 63 60 62 65

171
views

Domanda del libro di testo

Song Lengths Side-by-side box-and-whisker plots can be used to compare two or more different data sets. Each box-and-whisker plot is drawn on the same number line to compare the data sets more easily. The lengths (in seconds) of songs played at two different concerts are shown.

a. Describe the shape of each distribution. Which concert has less variation in song lengths?

122
views
Domanda del libro di testo

Extending Concepts


Golf The distances (in yards) for nine holes of a golf course are listed.

336 393 408 522 147 504 177 375 360


a. Find the mean and the median of the data.

87
views
Domanda del libro di testo

U.S. Trade Deficits The table at the left shows the U.S. trade deficits (in billions of dollars) with 18 countries in 2020. (Source: U.S. Department of Commerce)


" style="" width="280">


a. Find the mean and the median of the trade deficits.

68
views
Domanda del libro di testo

Drawing a Box-and-Whisker Plot In Exercises 15–18,

(a) find the five-number summary


2 7 1 3 1 2 8 9 9 2 5 4 7 3 7 5 4

2 3 5 9 5 6 3 9 3 4 9 8 8 2 3 9 5

172
views
Domanda del libro di testo

What Would You Do? You work at a bank and are asked to recommend the amount of cash to put in an ATM each day. You do not want to put in too much (which would cause security concerns) or too little (which may create customer irritation). The daily withdrawals (in hundreds of dollars) for 30 days are listed. 72 84 61 76 104 76 86 92 80 88 98 76 97 82 84 67 70 81 82 89 74 73 86 81 85 78 82 80 91 83

Construct a relative frequency histogram for the data. Use 8 classes.

112
views