

Ch. 3 - Probability
Larson - Elementary Statistics: Picturing the World 8th Edition
Larson8th EditionElementary Statistics: Picturing the WorldISBN: 9780137493470Non è quello che usi tu?Cambia libro di testo
Capitolo 3, Problema 3.3.19a

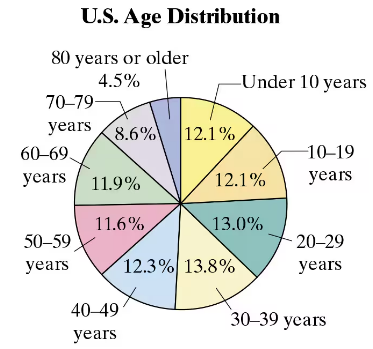
U.S. Age Distribution The projected percent distribution of the U.S. population for 2025 is shown in the pie chart. Find the probability of each event. (Source: U.S. Census
Bureau)
a. Randomly selecting someone who is under 10 years old
Pie chart showing U.S. age distribution for 2025, with percentages for each age group, including under 10 years.

Guida verificata passo dopo passo
1
Step 1: Understand the problem. The goal is to find the probability of randomly selecting someone who is under 10 years old from the U.S. population distribution for 2025. The pie chart provides the percentage distribution of different age groups.
Step 2: Identify the relevant data. From the pie chart, the percentage of the population under 10 years old is given as 12.1%. This percentage represents the proportion of the population in this age group.
Step 3: Convert the percentage to a probability. Probability is expressed as a decimal or fraction. To convert the percentage to a decimal, divide the percentage by 100. For example, \( P(\text{Under 10 years old}) = \frac{12.1}{100} \).
Step 4: Interpret the result. The probability represents the likelihood of randomly selecting someone under 10 years old from the population. Ensure the decimal value is between 0 and 1, as probabilities must fall within this range.
Step 5: Verify the calculation. Double-check the conversion and ensure the probability aligns with the percentage provided in the pie chart.

Risposta video verificata per un problema simile:

Questa soluzione video è stata consigliata dai nostri tutor come utile per risolvere questo problema.
Durata del video:
1m

Concetti chiave

Ecco i concetti essenziali che devi comprendere per rispondere correttamente alla domanda.

Probability

Probability is a measure of the likelihood that a particular event will occur, expressed as a number between 0 and 1. In this context, it refers to the chance of randomly selecting an individual from a population who falls into a specific age category, such as those under 10 years old. The probability can be calculated by dividing the number of individuals in the desired age group by the total population.
Video consigliato:
Percorso guidato
5:37
Introduction to Probability

Pie Chart Interpretation

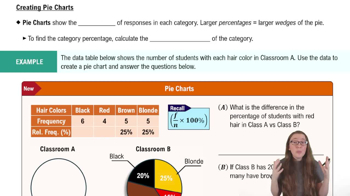
A pie chart is a circular statistical graphic divided into slices to illustrate numerical proportions. Each slice represents a category's contribution to the whole, with the size of each slice corresponding to the percentage of the population in that category. Understanding how to read and interpret the pie chart is essential for determining the probabilities associated with different age groups in the U.S. population.
Video consigliato:
Percorso guidato
06:10
Creating Pie Charts

Age Distribution

Age distribution refers to the proportion of individuals of different ages within a population. It provides insights into demographic trends and can influence various social and economic factors. In this question, the age distribution data from the pie chart helps identify the percentage of the population that is under 10 years old, which is crucial for calculating the probability of selecting someone from that age group.
Video consigliato:
Percorso guidato
06:06
Uniform Distribution
Pratica correlata
Domanda del libro di testo

"39. Reliability of Testing A virus infects one in every 200 people. A test used to detect the virus in a person is positive 80% of the time when the person has the virus and 5% of the time when the person does not have the virus. (This 5% result is called a false positive.) Let A be the event ""the person is infected"" and B be the event ""the person tests positive.""

a. Using Bayes' Theorem, when a person tests positive, determine the probability that the person is infected."

106
views
Domanda del libro di testo

26. Eye Survey The table shows the results of a survey that asked 3203 people whether they wore contacts or glasses. A person is selected at random from the sample. Find the probability of each event.

a. The person wears only contacts or only glasses.

" style="" width="480">

91
views
Domanda del libro di testo

2. Determine whether each number could represent the probability of an event. Explain your reasoning. a. 25/25

103
views
Domanda del libro di testo

Using the Multiplication Rule In Exercises 19-32, use the Multiplication Rule.

23. Celebrities as Role Models In a sample of 1103 probable voters, three out of four say they would like entertainers to address social and political issues. Two probable voters are selected at random. (Source: The Hollywood Reporter)

a. Find the probability that both probable voters would like entertainers to address social and political issues.

126
views
Domanda del libro di testo

"Using the Multiplication Rule In Exercises 19-32, use the Multiplication Rule.

27. Blood Types The probability that a person of Asian descent in the United States has type O+ blood is 39%. At random, six people of Asian descent in the United States are selected. (Source: American National Red Cross)

a. Find the probability that all six have type O+ blood."

53
views
Domanda del libro di testo

Using the Multiplication Rule In Exercises 19-32, use the Multiplication Rule.

25. Best President In a sample of 1500 adult U.S. citizens, 270 said that Barack Obama was the best president in U.S. history. Two adult U.S. citizens are selected at random.

(Adapted from YouGov)

a. Find the probability that both adult U.S. citizens say that Barack Obama was the best president in U.S. history.

92
views