Ch. 4 - Discrete Probability Distributions
Larson - Elementary Statistics: Picturing the World 8th Edition
Larson8th EditionElementary Statistics: Picturing the WorldISBN: 9780137493470Non è quello che usi tu?Cambia libro di testo
Capitolo 4, Problema 4.3.30

Geometric Distribution: Mean and Variance In Exercises 29 and 30, use the fact that the mean of a geometric distribution is μ = 1/p and the variance is
sigma^2 = q/p^2
Paycheck Errors A company assumes that 0.5% of the paychecks for a year were calculated incorrectly. The company has 200 employees and examines the payroll records from one month. (a) Find the mean, variance, and standard deviation. (b) How many employee payroll records would you expect to examine before finding one with an error?

Guida verificata passo dopo passo
1
Step 1: Understand the problem. The problem involves a geometric distribution, where the probability of success (finding an error) is p = 0.005 (0.5%). The formulas for the mean, variance, and standard deviation of a geometric distribution are given as follows: Mean (μ) = 1/p, Variance (σ²) = q/p², and Standard Deviation (σ) = √(Variance). Here, q = 1 - p is the probability of failure.
Step 2: Calculate the mean (μ). Using the formula μ = 1/p, substitute p = 0.005 into the equation. This will give you the expected number of payroll records to examine before finding one with an error.
Step 3: Calculate the variance (σ²). Using the formula σ² = q/p², first calculate q = 1 - p = 1 - 0.005 = 0.995. Then substitute q and p into the variance formula to compute the variance.
Step 4: Calculate the standard deviation (σ). Using the formula σ = √(Variance), take the square root of the variance calculated in the previous step to find the standard deviation.
Step 5: Interpret the results. The mean represents the expected number of payroll records to examine before finding one with an error. The variance and standard deviation provide measures of the spread or variability in the number of records examined before finding an error.

Risposta video verificata per un problema simile:

Questa soluzione video è stata consigliata dai nostri tutor come utile per risolvere questo problema.
Durata del video:
3m

Concetti chiave

Ecco i concetti essenziali che devi comprendere per rispondere correttamente alla domanda.

Geometric Distribution

The geometric distribution models the number of trials needed to achieve the first success in a series of independent Bernoulli trials. It is characterized by a constant probability of success, denoted as 'p'. The mean of this distribution is calculated as μ = 1/p, indicating the average number of trials expected before the first success occurs.
Video consigliato:
Percorso guidato
06:38
Intro to Frequency Distributions

Mean and Variance

In statistics, the mean represents the average value of a dataset, while variance measures the spread or dispersion of the data points around the mean. For a geometric distribution, the mean is μ = 1/p and the variance is σ² = q/p², where q = 1 - p. Understanding these concepts is crucial for analyzing the expected outcomes and variability in scenarios modeled by the geometric distribution.
Video consigliato:
Percorso guidato
08:24
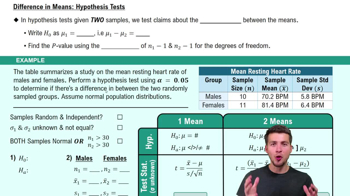
Difference in Means: Hypothesis Tests

Standard Deviation

Standard deviation is the square root of the variance and provides a measure of the average distance of each data point from the mean. It is a key indicator of variability in a dataset. In the context of the geometric distribution, calculating the standard deviation helps to understand the typical deviation from the mean number of trials needed to find the first success, which is essential for interpreting the results of the payroll error analysis.
Video consigliato:
Percorso guidato
08:45
Calculating Standard Deviation
Pratica correlata
Domanda del libro di testo

Determining a Missing Probability In Exercises 25 and 26, determine the missing probability for the probability distribution.

116
views

Domanda del libro di testo

"Using a Distribution to Find Probabilities In Exercises 11–26, find the indicated probabilities using the geometric distribution, the Poisson distribution, or the binomial distribution. Then determine whether the events are unusual. If convenient, use a table or technology to find the probabilities.


Typographical Errors A newspaper finds that the mean number of typographical errors per page is four. Find the probability that the number of typographical errors found on any given page is (a) exactly three, (b) at most three, and (c) more than three."

100
views
Domanda del libro di testo

Finding an Expected Value In Exercises 37 and 38, find the expected value E(x) to the player for one play of the game. If x is the gain to a player in a game of chance, then E(x) is usually negative. This value gives the average amount per game the player can expect to lose.


A high school basketball team is selling \$10 raffle tickets as part of a fund-raising program. The first prize is a trip to the Bahamas valued at \$5460, and the second prize is a weekend ski package valued at \$496. The remaining 18 prizes are \$100 gas cards. The number of tickets sold is 3500.

119
views
Domanda del libro di testo

Baseball There were 116 World Series from 1903 to 2020. Use the probability distribution in Exercise 30 to find the number of World Series that had 4, 5, 6, 7, and 8 games. Find the population mean, variance, and standard deviation of the data using the traditional definitions. Compare to your answers in Exercise 30.

77
views
Domanda del libro di testo

In Exercises 1–4, find the indicated probability using the geometric distribution.


Find P(5) when p = 0.09

135
views
Domanda del libro di testo

Graphical Analysis In Exercises 9–12, determine whether the graph on the number line represents a discrete random variable or a continuous random variable. Explain your reasoning.


The distance a baseball travels after being hit

75
views