Ch. 4 - Discrete Probability Distributions
Larson - Elementary Statistics: Picturing the World 8th Edition
Larson8th EditionElementary Statistics: Picturing the WorldISBN: 9780137493470Non è quello che usi tu?Cambia libro di testo
Capitolo 4, Problema 4.1.3

Is the expected value of the probability distribution of a random variable always one of the possible values of x? Explain.v

Guida verificata passo dopo passo
1
Understand the concept of expected value: The expected value (E[X]) of a random variable X is a weighted average of all possible values of X, where the weights are the probabilities associated with each value. It is calculated using the formula: E[X] = Σ (xᵢ * P(xᵢ)), where xᵢ represents the possible values of X and P(xᵢ) is the probability of xᵢ.
Recognize that the expected value is not necessarily one of the possible values of X: Since the expected value is a weighted average, it can be a value that does not correspond to any specific xᵢ in the probability distribution. For example, if the probabilities and values are distributed in such a way that the average lies between two possible values, the expected value will not match any specific xᵢ.
Consider an example to illustrate: Suppose a random variable X has possible values {1, 2, 3} with probabilities {0.2, 0.5, 0.3}. The expected value is calculated as E[X] = (1 * 0.2) + (2 * 0.5) + (3 * 0.3). The result may not be exactly 1, 2, or 3, but rather a value in between.
Understand the implications: The expected value represents the 'center' or 'balance point' of the probability distribution, but it does not have to correspond to an actual observed value of the random variable. This is a key distinction between the expected value and the mode or median, which may correspond to actual observed values.
Conclude with the answer: No, the expected value of a probability distribution is not always one of the possible values of X. It depends on the specific probabilities and values in the distribution, and it is often a value that lies between the possible values of X.

Risposta video verificata per un problema simile:

Questa soluzione video è stata consigliata dai nostri tutor come utile per risolvere questo problema.
Durata del video:
1m

Concetti chiave

Ecco i concetti essenziali che devi comprendere per rispondere correttamente alla domanda.

Expected Value

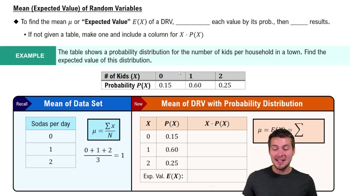
The expected value of a random variable is a measure of the central tendency of its probability distribution. It is calculated as the weighted average of all possible values, where each value is weighted by its probability of occurrence. The expected value provides a single summary statistic that represents the long-term average outcome of a random process.
Video consigliato:
Percorso guidato
04:14
Expected Value (Mean) of Random Variables

Probability Distribution

A probability distribution describes how the probabilities of a random variable are distributed across its possible values. It can be represented in various forms, such as a probability mass function for discrete variables or a probability density function for continuous variables. Understanding the shape and characteristics of a probability distribution is crucial for interpreting the expected value and other statistical measures.
Video consigliato:
Percorso guidato
06:39
Calculating Probabilities in a Binomial Distribution

Random Variable

A random variable is a numerical outcome of a random phenomenon, which can take on different values based on the outcome of a random process. Random variables can be classified as discrete, taking on specific values, or continuous, taking on any value within a range. The expected value of a random variable does not have to be one of its possible values; it can be a theoretical average that may not correspond to any actual outcome.
Video consigliato:
Percorso guidato
07:09
Intro to Random Variables & Probability Distributions