Ch. 5 - Normal Probability Distributions
Larson - Elementary Statistics: Picturing the World 8th Edition
Larson8th EditionElementary Statistics: Picturing the WorldISBN: 9780137493470Non è quello che usi tu?Cambia libro di testo
Capitolo 5, Problema 5.R.48

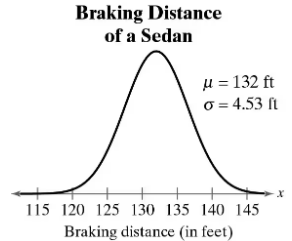
Graph showing the normal distribution of a sedan's braking distance, with mean 132 ft and standard deviation 4.53 ft.
What braking distance represents the first quartile?

Guida verificata passo dopo passo
1
Step 1: Understand the problem. The first quartile (Q1) represents the value below which 25% of the data falls in a normal distribution. To find Q1, we need to use the z-score corresponding to the 25th percentile in a standard normal distribution.
Step 2: Recall that the z-score for the 25th percentile in a standard normal distribution is approximately -0.674. This value is derived from standard normal tables or statistical software.
Step 3: Use the formula for converting a z-score to a value in a normal distribution: x = μ + zσ, where μ is the mean, σ is the standard deviation, and z is the z-score.
Step 4: Substitute the given values into the formula. Here, μ = 132 ft, σ = 4.53 ft, and z = -0.674. Plug these values into the formula to calculate the braking distance corresponding to the first quartile.
Step 5: Interpret the result. The calculated value will represent the braking distance below which 25% of the data falls, i.e., the first quartile.

Risposta video verificata per un problema simile:

Questa soluzione video è stata consigliata dai nostri tutor come utile per risolvere questo problema.
Durata del video:
4m

Concetti chiave

Ecco i concetti essenziali che devi comprendere per rispondere correttamente alla domanda.

Normal Distribution

Normal distribution is a probability distribution that is symmetric about the mean, depicting that data near the mean are more frequent in occurrence than data far from the mean. It is characterized by its bell-shaped curve, defined by its mean (µ) and standard deviation (σ). In this context, the braking distances of a sedan follow a normal distribution with a mean of 132 feet and a standard deviation of 4.53 feet.
Video consigliato:
Percorso guidato
06:23
Using the Normal Distribution to Approximate Binomial Probabilities

Quartiles

Quartiles are values that divide a dataset into four equal parts, each containing 25% of the data. The first quartile (Q1) is the value below which 25% of the data fall. To find Q1 in a normal distribution, one can use the z-score corresponding to the 25th percentile, which helps in determining the specific value of braking distance that represents this quartile.
Video consigliato:
Percorso guidato
04:51
Find 5-Number Summary - TI-84 Calculator

Z-Score

A z-score indicates how many standard deviations an element is from the mean. It is calculated using the formula z = (X - µ) / σ, where X is the value in question, µ is the mean, and σ is the standard deviation. For the first quartile, the z-score is approximately -0.674, which can be used to calculate the corresponding braking distance by rearranging the formula.
Video consigliato:
Percorso guidato
06:31
Z-Scores From Given Probability - TI-84 (CE) Calculator
Pratica correlata
Domanda del libro di testo

In Exercises 37–42, use the Standard Normal Table or technology to find the z-score that corresponds to the cumulative area or percentile.


P85

136
views

Domanda del libro di testo

In Exercises 55–60, find the indicated probabilities and interpret the results.


Refer to Exercise 34. A random sample of six days is selected. Find the probability that the mean surface concentration of carbonyl sulfide for the sample is (a) between 5.1 and 15.7 picomoles per liter. Compare your answers with those in Exercise 34.

45
views
Domanda del libro di testo

In Exercises 55–60, find the indicated probabilities and interpret the results.


The mean annual salary for Level 1 actuaries in the United States is about \$72,000. A random sample of 45 Level 1 actuaries is selected. What is the probability that the mean annual salary of the sample is (a) less than \$75,000? Assume sigma = \$11,000.

63
views
Domanda del libro di testo

In Exercises 55–60, find the indicated probabilities and interpret the results.


Refer to Exercise 33. A random sample of 2 years is selected. Find the probability that the mean amount of greenhouse gases for the sample is (a) less than 5500 MMT CO2 eq. Compare your answers with those in Exercise 33.

56
views
Domanda del libro di testo

In Exercises 55–60, find the indicated probabilities and interpret the results.


The mean annual salary for physical therapists in the United States is about \$87,000. A random sample of 50 physical therapists is selected. What is the probability that the mean annual salary of the sample is (a) less than \$84,000? Assume sigma = \$10,500.

74
views
Domanda del libro di testo

In Exercises 55–60, find the indicated probabilities and interpret the results.


The mean MCAT total score in a recent year is 500.9. A random sample of 32 MCAT total scores is selected. What is the probability that the mean score for the sample is (a) less than 503? Assume sigma=10.6.

54
views