



Ch. 5 - Normal Probability Distributions
Larson - Elementary Statistics: Picturing the World 8th Edition
Larson8th EditionElementary Statistics: Picturing the WorldISBN: 9780137493470Non è quello che usi tu?Cambia libro di testo
Capitolo 5, Problema 5.RS.2b

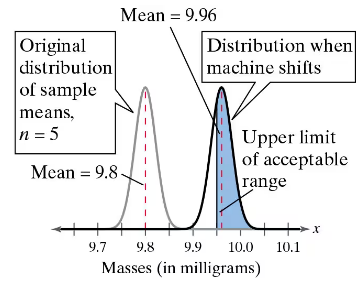
Assume the machine shifts and is filling the vials with a mean amount of 9.96 milligrams and a standard deviation of 0.05 milligram. You select five vials and find the mean amount of compound added.


Graph showing distributions of sample means with mean values and acceptable range limits for vial masses in milligrams.


b. You randomly select three samples of five vials. What is the probability that you select at least one sample of five vials that has a mean that is within the acceptable range?

Guida verificata passo dopo passo
1
Step 1: Understand the problem. The machine has shifted, and the mean amount of compound added to the vials is now 9.96 milligrams with a standard deviation of 0.05 milligrams. You are selecting three samples of five vials each, and you need to calculate the probability of selecting at least one sample where the mean is within the acceptable range.
Step 2: Calculate the standard error of the mean (SEM) for a sample size of 5. The formula for SEM is \( \text{SEM} = \frac{\sigma}{\sqrt{n}} \), where \( \sigma \) is the population standard deviation and \( n \) is the sample size. Substitute \( \sigma = 0.05 \) and \( n = 5 \) into the formula.
Step 3: Determine the z-scores corresponding to the acceptable range of means. Use the formula \( z = \frac{x - \mu}{\text{SEM}} \), where \( x \) is the value of interest, \( \mu \) is the population mean, and \( \text{SEM} \) is the standard error of the mean. The acceptable range is given in the graph, and you need to calculate the z-scores for the lower and upper limits of this range.
Step 4: Find the probability of a sample mean falling within the acceptable range using the z-scores. Use the standard normal distribution table or a statistical software to find the cumulative probabilities corresponding to the z-scores calculated in Step 3. Subtract the cumulative probability of the lower limit from the cumulative probability of the upper limit to get the probability for one sample.
Step 5: Calculate the probability of selecting at least one sample out of three that falls within the acceptable range. Use the complement rule: \( P(\text{at least one}) = 1 - P(\text{none}) \). First, calculate \( P(\text{none}) \) as \( (1 - P(\text{within range}))^3 \), then subtract this value from 1.

Risposta video verificata per un problema simile:

Questa soluzione video è stata consigliata dai nostri tutor come utile per risolvere questo problema.
Durata del video:
8m

Concetti chiave

Ecco i concetti essenziali che devi comprendere per rispondere correttamente alla domanda.

Sampling Distribution of the Mean

The sampling distribution of the mean describes the distribution of sample means obtained from a population. When samples of a fixed size are taken, the means of these samples will form their own distribution, which will be normally distributed if the sample size is sufficiently large, according to the Central Limit Theorem. In this case, the mean of the sampling distribution is equal to the population mean, and the standard deviation is the population standard deviation divided by the square root of the sample size.
Video consigliato:
Percorso guidato
05:11
Sampling Distribution of Sample Proportion

Standard Error

Standard error is a measure of the variability of sample means around the population mean. It is calculated as the population standard deviation divided by the square root of the sample size (n). In this scenario, with a standard deviation of 0.05 milligrams and a sample size of 5, the standard error helps determine how much the sample mean is expected to fluctuate from the true population mean of 9.96 milligrams.
Video consigliato:
Percorso guidato
08:45
Calculating Standard Deviation

Probability and Acceptable Range

Probability in statistics quantifies the likelihood of an event occurring. In this context, it refers to the chance of selecting at least one sample of five vials whose mean falls within a specified acceptable range. Understanding how to calculate this probability involves using the properties of the normal distribution and the concept of cumulative probability, which can be visualized in the provided graph showing the distribution of sample means.
Video consigliato:
Percorso guidato
5:37
Introduction to Probability
Pratica correlata
Domanda del libro di testo

Assume the machine shifts and is filling the vials with a mean amount of 9.96 milligrams and a standard deviation of 0.05 milligram. You select five vials and find the mean amount of compound added.


c. Which is more sensitive to a shift of parameters—an individual random selection or a randomly selected sample mean?

79
views
Domanda del libro di testo

In Exercises 1 and 2, use the normal curve to estimate the mean and standard deviation.


106
views
Domanda del libro di testo

In Exercises 5 and 6, find the area of the indicated region under the standard normal curve. If convenient, use technology to find the area.


73
views
Domanda del libro di testo

Assume the machine shifts and the distribution of the amount of the compound added now has a mean of 9.96 milligrams and a standard deviation of 0.05 milligram. You select one vial and determine how much of the compound was added.


a. What is the probability that you select a vial that is within the acceptable range (in other words, you do not detect that the machine has shifted)? (See figure.)

76
views
Domanda del libro di testo

Assume the machine shifts and the distribution of the amount of the compound added now has a mean of 9.96 milligrams and a standard deviation of 0.05 milligram. You select one vial and determine how much of the compound was added.

b. You randomly select 15 vials. What is the probability that you select at least one vial that is within the acceptable range?


53
views
Domanda del libro di testo

Assume the machine shifts and is filling the vials with a mean amount of 9.96 milligrams and a standard deviation of 0.05 milligram. You select five vials and find the mean amount of compound added.


a. What is the probability that you select a sample of five vials that has a mean that is within the acceptable range? (See figure.)

81
views