


Ch. 5 - Normal Probability Distributions
Larson - Elementary Statistics: Picturing the World 8th Edition
Larson8th EditionElementary Statistics: Picturing the WorldISBN: 9780137493470Non è quello che usi tu?Cambia libro di testo
Capitolo 5, Problema 5.3.9

Finding a z-Score In Exercises 1–16, use the Standard Normal Table or technology to find the z-score that corresponds to the cumulative area or percentile.


P33

Guida verificata passo dopo passo
1
Identify the given information: The problem states that we need to find the z-score corresponding to the 33rd percentile (P33). This means the cumulative area under the standard normal curve to the left of the z-score is 0.33.
Understand the relationship between cumulative area and z-scores: The cumulative area represents the probability that a randomly selected value from the standard normal distribution is less than or equal to the z-score. We will use the Standard Normal Table or technology to find the z-score corresponding to this cumulative area.
Use the Standard Normal Table: Locate the cumulative area of 0.33 in the table. The table provides cumulative probabilities for z-scores. Find the row and column that correspond to the closest value to 0.33. The intersection of the row and column gives the z-score.
Alternatively, use technology: If using a statistical calculator or software, input the cumulative area (0.33) into the inverse normal function (often labeled as 'invNorm' or similar). Ensure the mean is set to 0 and the standard deviation is set to 1, as this is a standard normal distribution.
Interpret the result: The z-score you find represents the point on the standard normal distribution where 33% of the data lies to the left. This z-score can be used for further analysis or interpretation in the context of the problem.

Risposta video verificata per un problema simile:

Questa soluzione video è stata consigliata dai nostri tutor come utile per risolvere questo problema.
Durata del video:
1m

Concetti chiave

Ecco i concetti essenziali che devi comprendere per rispondere correttamente alla domanda.

Z-Score

A z-score is a statistical measurement that describes a value's relationship to the mean of a group of values. It indicates how many standard deviations an element is from the mean. A positive z-score indicates the value is above the mean, while a negative z-score indicates it is below. Z-scores are essential for standardizing scores on different scales, allowing for comparison across different datasets.
Video consigliato:
Percorso guidato
06:31
Z-Scores From Given Probability - TI-84 (CE) Calculator

Standard Normal Distribution

The standard normal distribution is a special case of the normal distribution where the mean is 0 and the standard deviation is 1. It is represented by the bell-shaped curve and is used to determine probabilities and percentiles for normally distributed data. The area under the curve corresponds to probabilities, making it a fundamental concept in statistics for understanding how data is distributed.
Video consigliato:
Percorso guidato
09:47
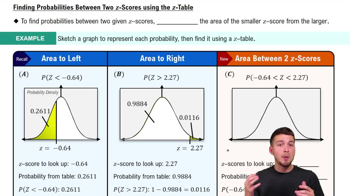
Finding Standard Normal Probabilities using z-Table

Cumulative Area

Cumulative area refers to the total area under the curve of a probability distribution up to a certain point. In the context of the standard normal distribution, it represents the probability that a randomly selected score will fall below a specific z-score. This concept is crucial for interpreting z-scores in terms of percentiles, allowing statisticians to understand the relative standing of a score within a distribution.
Video consigliato:
Percorso guidato
03:50
Probabilities Between Two Values
Pratica correlata
Domanda del libro di testo

In Exercises 21–24, a control chart is shown. Each chart has horizontal lines drawn at the mean mu, at mu ±2sigma, and at mu±3sigma. Determine whether the process shown is in control or out of control. Explain.


An engine part has been designed to have a diameter of 55 millimeters. The standard deviation of the process is 0.001 millimeter.


55
views
Domanda del libro di testo

Graphical Analysis In Exercises 13–16, a member is selected at random from the population represented by the graph. Find the probability that the member selected at random is from the shaded region of the graph. Assume the variable x is normally distributed.


" style="" width="282">

70
views
Domanda del libro di testo

Using and Interpreting Concepts

Finding Area In Exercises 17–22, find the area of the shaded region under the standard normal curve. If convenient, use technology to find the area.

81
views
Domanda del libro di testo

True or False? In Exercises 5–8, determine whether the statement is true or false. If it is false, rewrite it as a true statement.


If the sample size is at least 30, then you can use z-scores to determine the probability that a sample mean falls in a given interval of the sampling distribution.

104
views
Domanda del libro di testo

Graphical Analysis In Exercises 11–16, determine whether the graph could represent a variable with a normal distribution. Explain your reasoning. If the graph appears to represent a normal distribution, estimate the mean and standard deviation.

90
views
Domanda del libro di testo

Finding a z-Score In Exercises 1–16, use the Standard Normal Table or technology to find the z-score that corresponds to the cumulative area or percentile.


0.94

202
views