


Ch. 5 - Normal Probability Distributions
Larson - Elementary Statistics: Picturing the World 8th Edition
Larson8th EditionElementary Statistics: Picturing the WorldISBN: 9780137493470Non è quello che usi tu?Cambia libro di testo
Capitolo 5, Problema 5.1.23

Finding Area
In Exercises 23–36, find the indicated area under the standard normal curve. If convenient, use technology to find the area.


To the left of z=0.33

Guida verificata passo dopo passo
1
Step 1: Understand the problem. You are tasked with finding the area under the standard normal curve to the left of z = 0.33. The standard normal curve is a bell-shaped curve with a mean of 0 and a standard deviation of 1.
Step 2: Recall that the area under the standard normal curve represents probabilities. To find the area to the left of z = 0.33, you need to use the cumulative distribution function (CDF) for the standard normal distribution.
Step 3: Use the z-score table (also called the standard normal table) or technology (such as a graphing calculator, statistical software, or an online tool) to find the cumulative probability corresponding to z = 0.33. The table or tool will provide the area under the curve to the left of this z-score.
Step 4: If using a z-score table, locate the row corresponding to the first two digits of the z-score (0.3) and the column corresponding to the second decimal place (0.03). The intersection of this row and column gives the cumulative probability.
Step 5: If using technology, input the z-score (0.33) into the appropriate function for the standard normal CDF. For example, in a calculator, you might use a function like 'normalcdf(-∞, 0.33)' or 'P(Z ≤ 0.33)'. The result will be the area to the left of z = 0.33.

Risposta video verificata per un problema simile:

Questa soluzione video è stata consigliata dai nostri tutor come utile per risolvere questo problema.
Durata del video:
3m

Concetti chiave

Ecco i concetti essenziali che devi comprendere per rispondere correttamente alla domanda.

Standard Normal Distribution

The standard normal distribution is a special normal distribution with a mean of 0 and a standard deviation of 1. It is represented by the variable 'z', which indicates how many standard deviations an element is from the mean. This distribution is crucial for calculating probabilities and areas under the curve, as it allows for the standardization of different normal distributions.
Video consigliato:
Percorso guidato
09:47
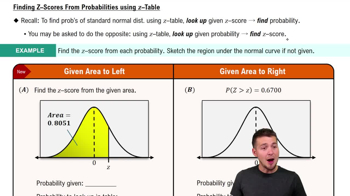
Finding Standard Normal Probabilities using z-Table

Z-Score

A z-score is a statistical measurement that describes a value's relationship to the mean of a group of values. It is calculated by subtracting the mean from the value and then dividing by the standard deviation. In the context of the standard normal distribution, a z-score indicates how far and in what direction a data point deviates from the mean, which is essential for finding areas under the curve.
Video consigliato:
Percorso guidato
06:31
Z-Scores From Given Probability - TI-84 (CE) Calculator

Area Under the Curve

The area under the curve of a probability distribution represents the probability of a random variable falling within a particular range. For the standard normal distribution, this area can be found using z-scores and standard normal distribution tables or technology. In this case, finding the area to the left of z=0.33 involves calculating the cumulative probability up to that z-score.
Video consigliato:
Percorso guidato
08:50
Z-Scores from Probabilities
Pratica correlata
Domanda del libro di testo

Finding Probabilities In Exercises 15–18, the population mean and standard deviation are given. Find the indicated probability and determine whether the given sample mean would be considered unusual.


For a random sample of n=36, find the probability of a sample mean being less than 12,750 or greater than 12,753 when mu=12750 and 1.7.

105
views
Domanda del libro di testo

In Exercises 1–4, a population has a mean mu and a standard deviation sigma. Find the mean and standard deviation of the sampling distribution of sample means with sample size n.


Mu = 150, sigma =25, n = 49

102
views
Domanda del libro di testo

Graphical Analysis In Exercises 9 and 10, the graph of a population distribution is shown with its mean and standard deviation. Random samples of size 100 are drawn from the population. Determine which of the figures labeled (a)–(c) would most closely resemble the sampling distribution of sample means. Explain your reasoning.


The waiting time (in seconds) to turn left at an intersection

76
views
Domanda del libro di testo

Construction About 63% of the residents in a town are in favor of building a new high school. One hundred five residents are randomly selected. What is the probability that the sample proportion in favor of building a new school is less than 55%? Interpret your result.

92
views
Domanda del libro di testo

Graphical Analysis In Exercises 17–22, find the indicated z-score(s) shown in the graph.


" style="" width="260">

116
views
Domanda del libro di testo

Finding a z-Score In Exercises 1–16, use the Standard Normal Table or technology to find the z-score that corresponds to the cumulative area or percentile.


P91

128
views