Ch. 6 - Confidence Intervals
Larson - Elementary Statistics: Picturing the World 8th Edition
Larson8th EditionElementary Statistics: Picturing the WorldISBN: 9780137493470Non è quello che usi tu?Cambia libro di testo
Capitolo 6, Problema 6.3.14

Constructing Confidence Intervals In Exercises 13 and 14, construct a 99% confidence interval for the population proportion. Interpret the results.
New Year’s Resolutions In a survey of 1790 U.S. adults in a recent year, 816 have a New Year’s resolution related to their health. (Adapted from Finder)

Guida verificata passo dopo passo
1
Step 1: Identify the sample proportion (p̂) and the sample size (n). The sample proportion is calculated as p̂ = x / n, where x is the number of successes (816) and n is the total sample size (1790).
Step 2: Determine the critical value (z*) for a 99% confidence level. For a 99% confidence interval, the critical value corresponds to the z-score that leaves 0.5% in each tail of the standard normal distribution. This value can be found using a z-table or statistical software.
Step 3: Calculate the standard error (SE) of the sample proportion using the formula SE = sqrt((p̂ * (1 - p̂)) / n). This measures the variability of the sample proportion.
Step 4: Construct the confidence interval using the formula: Confidence Interval = p̂ ± z* × SE. This provides the range of plausible values for the population proportion.
Step 5: Interpret the results. The 99% confidence interval means that we are 99% confident that the true population proportion of U.S. adults with a New Year’s resolution related to their health falls within the calculated interval.

Risposta video verificata per un problema simile:

Questa soluzione video è stata consigliata dai nostri tutor come utile per risolvere questo problema.
Durata del video:
4m

Concetti chiave

Ecco i concetti essenziali che devi comprendere per rispondere correttamente alla domanda.

Confidence Interval

A confidence interval is a range of values, derived from sample statistics, that is likely to contain the true population parameter with a specified level of confidence, such as 99%. It provides an estimate of uncertainty around the sample proportion, allowing researchers to infer about the population based on sample data.
Video consigliato:
Percorso guidato
06:33
Introduction to Confidence Intervals

Population Proportion

The population proportion is the ratio of members of a population that have a particular characteristic, expressed as a decimal or percentage. In this context, it refers to the proportion of U.S. adults who have a New Year’s resolution related to their health, which can be estimated using sample data.
Video consigliato:
Percorso guidato
05:45
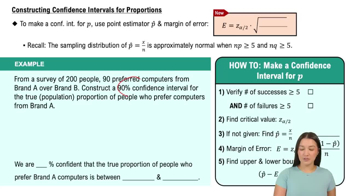
Constructing Confidence Intervals for Proportions

Margin of Error

The margin of error quantifies the uncertainty associated with a sample estimate. It is calculated based on the sample size and the variability of the data, and it indicates how much the sample proportion might differ from the true population proportion. A smaller margin of error leads to a more precise confidence interval.
Video consigliato:
Percorso guidato
04:08
Finding the Minimum Sample Size Needed for a Confidence Interval