Ch. 6 - Confidence Intervals
Larson - Elementary Statistics: Picturing the World 8th Edition
Larson8th EditionElementary Statistics: Picturing the WorldISBN: 9780137493470Non è quello che usi tu?Cambia libro di testo
Capitolo 6, Problema 6.4.15b

Constructing Confidence Intervals In Exercises 13–24, assume the sample is from a normally distributed population and construct the indicated confidence intervals for (b) the population standard deviation σ. Interpret the results.
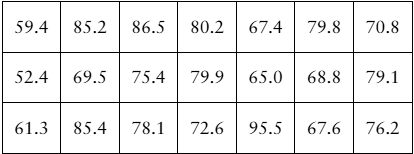
[APPLET] Earnings The annual earnings (in thousands of dollars) of 21 randomly selected level 1 computer hardware engineers are listed. Use a 99% level of confidence. (Adapted from Salary.com)

Guida verificata passo dopo passo
1
Step 1: Identify the sample size (n), which is given as 21, and note that the data is from a normally distributed population. Extract the earnings data from the table provided.
Step 2: Calculate the sample variance (s²) using the formula: s² = (Σ(xᵢ - x̄)²) / (n - 1), where x̄ is the sample mean, xᵢ are the individual data points, and n is the sample size. First, compute the sample mean (x̄) by summing all the data points and dividing by n.
Step 3: Use the Chi-Square distribution to construct the confidence interval for the population variance (σ²). The formula for the confidence interval is: [(n - 1)s² / χ²(α/2)], [(n - 1)s² / χ²(1 - α/2)], where χ²(α/2) and χ²(1 - α/2) are the critical values from the Chi-Square distribution table for the given confidence level (99%) and degrees of freedom (df = n - 1).
Step 4: To find the confidence interval for the population standard deviation (σ), take the square root of the lower and upper bounds of the variance confidence interval calculated in Step 3.
Step 5: Interpret the results: The confidence interval provides a range of values within which the true population standard deviation is likely to fall, with 99% confidence. This means that if we were to repeat the sampling process many times, 99% of the intervals constructed would contain the true population standard deviation.

Risposta video verificata per un problema simile:

Questa soluzione video è stata consigliata dai nostri tutor come utile per risolvere questo problema.
Durata del video:
5m

Concetti chiave

Ecco i concetti essenziali che devi comprendere per rispondere correttamente alla domanda.

Confidence Interval

A confidence interval is a range of values, derived from sample statistics, that is likely to contain the true population parameter with a specified level of confidence. For example, a 99% confidence interval suggests that if we were to take many samples and construct intervals in the same way, approximately 99% of those intervals would contain the true population parameter.
Video consigliato:
Percorso guidato
06:33
Introduction to Confidence Intervals

Population Standard Deviation (σ)

The population standard deviation (σ) is a measure of the amount of variation or dispersion in a set of values in a population. It quantifies how much individual data points differ from the population mean. In constructing confidence intervals for σ, we often use sample data to estimate this parameter, which is crucial for understanding the variability of the population.
Video consigliato:
Percorso guidato
08:45
Calculating Standard Deviation

Normal Distribution

Normal distribution is a probability distribution that is symmetric about the mean, showing that data near the mean are more frequent in occurrence than data far from the mean. Many statistical methods, including confidence interval construction, assume that the underlying population is normally distributed, especially when sample sizes are small, as it affects the validity of the results.
Video consigliato:
Percorso guidato
06:23
Using the Normal Distribution to Approximate Binomial Probabilities
Pratica correlata
Domanda del libro di testo

When all other quantities remain the same, how does the indicated change affect the minimum sample size requirement? Explain.

b. Increase in the error tolerance

83
views

Domanda del libro di testo

Constructing Confidence Intervals In Exercises 13–24, assume the sample is from a normally distributed population and construct the indicated confidence intervals for (b) the population standard deviation σ. Interpret the results.

Car Batteries The reserve capacities (in hours) of 18 randomly selected automotive batteries have a sample standard deviation of 0.25 hour. Use an 80% level of confidence.

97
views
Domanda del libro di testo

Senate Filibuster You wish to estimate, with 99% confidence, the population proportion of U.S. adults who disapprove of the U.S Senate’s use of the filibuster. Your estimate must be accurate within 2% of the population proportion.

b. Find the minimum sample size needed, using a prior survey that found that 34% of U.S. adults disapprove of the U.S Senate’s use of the filibuster. (Source: Monmouth University)

62
views
Domanda del libro di testo

Congress You wish to estimate, with 95% confidence, the population proportion of likely U.S. voters who think Congress is doing a good or excellent job. Your estimate must be accurate within 4% of the population proportion.

b. Find the minimum sample size needed, using a prior survey that found that 21% of likely U.S. voters think Congress is doing a good or excellent job. (Source: Rasmussen Reports)

91
views
Domanda del libro di testo

Constructing Confidence Intervals In Exercises 13–24, assume the sample is from a normally distributed population and construct the indicated confidence intervals for (b) the population standard deviation σ. Interpret the results.

Annual Precipitation The annual precipitation amounts (in inches) of a random sample of 61 years for Chicago, Illinois, have a sample standard deviation of 6.46. Use a 98% level of confidence. (Source: National Oceanic and Atmospheric Administration)

60
views
Domanda del libro di testo

Alcohol-Impaired Driving You wish to estimate, with 95% confidence, the population proportion of motor vehicle fatalities that were caused by alcohol-impaired driving. Your estimate must be accurate within 5% of the population proportion.

b. Find the minimum sample size needed, using a prior study that found that 28% of motor vehicle fatalities were caused by alcohol-impaired driving. (Source: National Highway Traffic Safety Administration)

77
views