Ch. 6 - Confidence Intervals
Larson - Elementary Statistics: Picturing the World 8th Edition
Larson8th EditionElementary Statistics: Picturing the WorldISBN: 9780137493470Non è quello che usi tu?Cambia libro di testo
Capitolo 6, Problema 6.3.4

"Finding p^ and q^ In Exercises 3–6, let p be the population proportion for the situation. Find point estimates of p and q.
Social Security In a survey of 351 retired Americans, 200 said that they rely on Social Security as major source of income. (Adapted from Gallup)"

Guida verificata passo dopo passo
1
Identify the given values: The total number of surveyed retired Americans is 351, and the number of those who rely on Social Security as a major source of income is 200.
Understand the formula for the point estimate of the population proportion (p^): p^ = x / n, where x is the number of successes (in this case, the number of people relying on Social Security) and n is the total sample size.
Substitute the given values into the formula: p^ = 200 / 351.
Calculate the complement of the population proportion (q^): q^ = 1 - p^. This represents the proportion of people who do not rely on Social Security as a major source of income.
Summarize the results: p^ is the point estimate for the proportion of people relying on Social Security, and q^ is the complement proportion. These values are derived from the sample data.

Risposta video verificata per un problema simile:

Questa soluzione video è stata consigliata dai nostri tutor come utile per risolvere questo problema.
Durata del video:
2m

Concetti chiave

Ecco i concetti essenziali che devi comprendere per rispondere correttamente alla domanda.

Population Proportion

The population proportion, denoted as p, represents the fraction of a population that possesses a certain characteristic. In this context, it refers to the proportion of retired Americans who rely on Social Security as a major source of income. Understanding this concept is crucial for estimating how widespread a particular opinion or behavior is within a larger group.
Video consigliato:
Percorso guidato
02:35
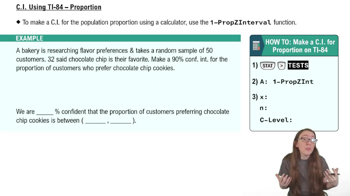
Finding a Confidence Interval for a Population Proportion Using a TI84

Point Estimate

A point estimate is a single value that serves as an approximation of a population parameter. In this case, p^ (p-hat) is the point estimate of the population proportion p, calculated from sample data. It provides a quick and straightforward way to summarize the data, allowing for easier interpretation and communication of results.
Video consigliato:
Percorso guidato
06:33
Introduction to Confidence Intervals

Complement of a Proportion

The complement of a proportion, denoted as q, represents the proportion of the population that does not have the characteristic of interest. In this scenario, q would be the proportion of retired Americans who do not rely on Social Security as a major source of income. Understanding both p and q is essential for a complete analysis of the survey results.
Video consigliato:
Percorso guidato
08:09
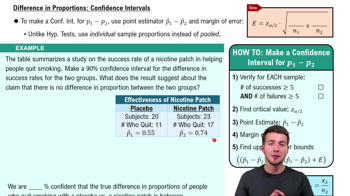
Difference in Proportions: Confidence Intervals
Pratica correlata
Domanda del libro di testo

In Exercises 7–10, use the confidence interval to find the margin of error and the sample proportion.

(0.512, 0.596)

117
views

Domanda del libro di testo

Translating Statements In Exercises 29–34, translate the statement into a confidence interval. Approximate the level of confidence.

In a survey of 1502 U.S. adults, 31% said that they use Pinterest. The survey’s margin of error is ±2.9%. (Source: Pew Research Center)

49
views
Domanda del libro di testo

In Exercises 9–12, construct the indicated confidence intervals for (a) the population variance and (b) the population standard deviation . Assume the sample is from a normally distributed population.

c = 0.95, s^2 = 11.56, n = 30

67
views
Domanda del libro di testo

The data set represents the amounts of time (in minutes) spent checking email for a random sample of employees at a company.

c. Repeat part (b), assuming σ = 3.5 minutes. Compare the results.

57
views
Domanda del libro di testo

[APPLET] The winning times (in hours) for a sample of 20 randomly selected Boston Marathon Women’s Open Division champions from 1980 to 2019 are shown in the table at the left. Assume the population standard deviation is 0.068 hour. (Source: Boston Athletic Association)

a. Find the point estimate of the population mean.

55
views
Domanda del libro di testo

You wish to estimate the mean winning time for Boston Marathon Women’s Open Division champions. The estimate must be within 2 minutes of the population mean. Determine the minimum sample size required to construct a 99% confidence interval for the population mean. Use the population standard deviation from Exercise 1.

72
views