

Ch. 7 - Hypothesis Testing with One Sample
Larson - Elementary Statistics: Picturing the World 8th Edition
Larson8th EditionElementary Statistics: Picturing the WorldISBN: 9780137493470Non è quello che usi tu?Cambia libro di testo
Capitolo 7, Problema 7.T.7

[APPLET] A researcher claims that the mean age of the residents of a small town is more than 38 years. The ages (in years) of a random sample of 30 residents are listed below. At α=0.10, is there enough evidence to support the researcher’s claim? Assume the population standard deviation is 9 years.


Table displaying ages of 30 residents, with values ranging from 21 to 87 years, for hypothesis testing analysis.

Guida verificata passo dopo passo
1
Step 1: Formulate the null and alternative hypotheses. The null hypothesis (H₀) is that the mean age of the residents is 38 years (μ = 38). The alternative hypothesis (H₁) is that the mean age of the residents is greater than 38 years (μ > 38).
Step 2: Calculate the sample mean (x̄). Add all the ages provided in the sample and divide by the total number of residents (n = 30). Use the formula: x̄=∑xn.
Step 3: Compute the test statistic using the z-test formula for a population mean. The formula is: z=x̄-μσn, where μ = 38, σ = 9, and n = 30.
Step 4: Determine the critical value for α = 0.10 in a one-tailed z-test. Look up the z-value corresponding to a significance level of 0.10 in a z-table. This critical value will help decide whether to reject or fail to reject the null hypothesis.
Step 5: Compare the calculated z-test statistic to the critical value. If the test statistic is greater than the critical value, reject the null hypothesis and conclude that there is enough evidence to support the researcher’s claim. Otherwise, fail to reject the null hypothesis.

Risposta video verificata per un problema simile:

Questa soluzione video è stata consigliata dai nostri tutor come utile per risolvere questo problema.
Durata del video:
7m

Concetti chiave

Ecco i concetti essenziali che devi comprendere per rispondere correttamente alla domanda.

Hypothesis Testing

Hypothesis testing is a statistical method used to make decisions about a population based on sample data. It involves formulating a null hypothesis (H0) and an alternative hypothesis (H1). In this case, the null hypothesis states that the mean age is 38 years or less, while the alternative hypothesis posits that it is greater than 38 years. The goal is to determine if there is enough evidence to reject the null hypothesis at a specified significance level.
Video consigliato:
Percorso guidato
06:21
Step 1: Write Hypotheses

Significance Level (α)

The significance level, denoted as α, is the probability of rejecting the null hypothesis when it is actually true, also known as a Type I error. In this scenario, α is set at 0.10, meaning there is a 10% risk of concluding that the mean age is greater than 38 years when it is not. This threshold helps researchers decide how strong the evidence must be to support the alternative hypothesis.
Video consigliato:
Percorso guidato
03:33
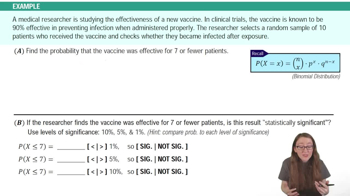
Finding Binomial Probabilities Using TI-84 Example 1

Z-Test for Means

A Z-test for means is a statistical test used to determine if there is a significant difference between the sample mean and a known population mean when the population standard deviation is known. In this case, the sample of 30 residents' ages will be analyzed using the Z-test to compare the sample mean against the hypothesized mean of 38 years, utilizing the provided population standard deviation of 9 years to calculate the Z-score.
Video consigliato:
Percorso guidato
08:24
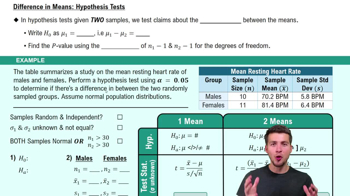
Difference in Means: Hypothesis Tests
Pratica correlata
Domanda del libro di testo

Interpreting a Decision In Exercises 43–48, determine whether the claim represents the null hypothesis or the alternative hypothesis. If a hypothesis test is performed, how should you interpret a decision that


a. rejects the null hypothesis?


Gas Mileage An automotive manufacturer claims that the standard deviation for the gas mileage of one of the vehicles it manufactures is 3.9 miles per gallon.

54
views
Domanda del libro di testo

A nutrition bar manufacturer claims that the standard deviation of the number of grams of carbohydrates in a bar is 1.11 grams. A random sample of 26 bars has a standard deviation of 1.19 grams. At α=0.05, is there enough evidence to reject the manufacturer’s claim? Assume the population is normally distributed.

68
views
Domanda del libro di testo

You want your test to support a positive claim about your college, not just fail to reject one. Should you state your claim so that the null hypothesis contains the claim or the alternate hypothesis contains the claim? Explain.

77
views
Domanda del libro di testo

When you reject a true claim with a level of significance that is virtually zero, what can you infer about the randomness of your sampling process?

53
views
Domanda del libro di testo

A research center claims that more than 80% of U.S. adults think that mothers should have paid maternity leave. In a random sample of 50 U.S. adults, 82% think that mothers should have paid maternity leave. At α=0.05, is there enough evidence to support the center’s claim?

60
views
Domanda del libro di testo

A travel analyst says that the mean price of a meal for a family of 4 in a resort restaurant is at most \$100. A random sample of 33 meal prices for families of 4 has a mean of \$110 and a standard deviation of \$19. At α=0.01, is there enough evidence to reject the analyst’s claim?

54
views