Ch. 7 - Hypothesis Testing with One Sample
Larson - Elementary Statistics: Picturing the World 8th Edition
Larson8th EditionElementary Statistics: Picturing the WorldISBN: 9780137493470Non è quello che usi tu?Cambia libro di testo
Capitolo 7, Problema 7.2.28

Finding Critical Values and Rejection Regions In Exercises 23–28, find the critical value(s) and rejection region(s) for the type of z-test with level of significance α. Include a graph with your answer.


Two-tailed test, α = 0.12

Guida verificata passo dopo passo
1
Step 1: Understand the problem. This is a two-tailed z-test with a significance level (α) of 0.12. In a two-tailed test, the rejection regions are located in both tails of the standard normal distribution, and the total area of the rejection regions equals α.
Step 2: Divide the significance level (α) equally between the two tails. Since α = 0.12, each tail will have an area of α/2 = 0.12/2 = 0.06.
Step 3: Use the standard normal distribution table (z-table) or a statistical calculator to find the z-scores that correspond to the cumulative probabilities of 0.06 (left tail) and 1 - 0.06 = 0.94 (right tail). These z-scores are the critical values.
Step 4: Define the rejection regions. The rejection regions are the areas in the tails of the distribution where the test statistic falls outside the critical values. For a two-tailed test, the rejection regions are z < -z_critical (left tail) and z > z_critical (right tail).
Step 5: Visualize the result. Draw a standard normal distribution curve, mark the critical values on the z-axis, and shade the rejection regions in both tails. This graph helps to clearly illustrate the critical values and rejection regions.

Risposta video verificata per un problema simile:

Questa soluzione video è stata consigliata dai nostri tutor come utile per risolvere questo problema.
Durata del video:
2m

Concetti chiave

Ecco i concetti essenziali che devi comprendere per rispondere correttamente alla domanda.

Critical Value

A critical value is a point on the scale of the test statistic that separates the region where the null hypothesis is rejected from the region where it is not rejected. In hypothesis testing, critical values are determined based on the significance level (α) and the type of test (one-tailed or two-tailed). For a two-tailed test, critical values are found at both extremes of the distribution.
Video consigliato:
Percorso guidato
05:50
Critical Values: t-Distribution

Rejection Region

The rejection region is the range of values for the test statistic that leads to the rejection of the null hypothesis. In a two-tailed test, this region is divided into two parts, corresponding to the critical values on either side of the distribution. The size of the rejection region is determined by the significance level (α), which indicates the probability of making a Type I error.
Video consigliato:
Percorso guidato
09:56
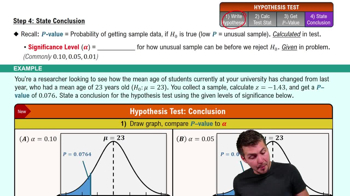
Step 4: State Conclusion

Two-Tailed Test

A two-tailed test is a statistical test that evaluates whether a sample mean is significantly different from a population mean in either direction (greater than or less than). This type of test is used when the alternative hypothesis does not specify a direction of the effect. For a significance level of α = 0.12, the critical values will be located at the 6% and 94% percentiles of the standard normal distribution.
Video consigliato:
Percorso guidato
09:27
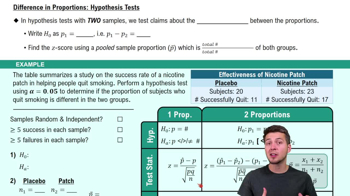
Difference in Proportions: Hypothesis Tests